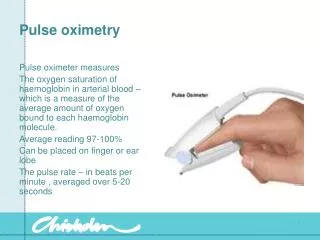
Pulse Oximetry
Pulse Oximetry. Dr.C.N.Chandra Sekhar M.D. Oxygenation. Oxygen tension Oxygen content Oxygen saturation. Oxygen tension. Clarke electrode Fuel cell Transcutaneous electrodes. Oxygen content. (SpO 2 x Hb x 1.34) + 0.003 x PO 2. Oxygen Saturation.

Pulse Oximetry
E N D
Presentation Transcript
Pulse Oximetry Dr.C.N.Chandra Sekhar M.D
Oxygenation • Oxygen tension • Oxygen content • Oxygen saturation
Oxygen tension • Clarke electrode • Fuel cell • Transcutaneous electrodes
Oxygen content (SpO2 x Hb x 1.34) + 0.003 x PO2
Oxygen Saturation • ODC Curve: • Plot of degree of Hb saturation against oxygen tension
PULSE OXIMETRY • Uses spectrophotometry based on the Beer-Lambert law • Differentiates oxy- from deoxyhemoglobin by the differences in absorption at 660nm and 940nm • Minimizes tissue interference by separating out the pulsatile signal
PULSE OXIMETRY • Estimates heart rate by measuring cyclic changes in light transmission • Measures 4 types of hemoglobin: deoxy, oxy, carboxy, and met • Estimates functional hemoglobin saturation: oxyhemoglobin/deoxy + oxy
Beer-Lambert’s Law • Beer’s Law: • The intensity of transmitted light decreases exponentially with the concentration of the substance • Lambert’s Law: • The intensity of transmitted light decreases exponentially with the distance it travels
SOURCES OF ERROR • Sensitive to motion • Standard deviation is certified to 2-3% down to 70% saturation • Sats below 85% increase the importance of error in the reading • Calibration is performed by company on normal patients breathing various gas mixtures, so calibration is certain only down to 80%
SOURCES OF ERROR • Skin Pigmentation • Darker color may make the reading more variable due to optical shunting. • Dark nail polish has same effect: blue, black, and green polishes underestimate saturations, while red and purple have no effect • Hyperbilirubinemia has no effect
SOURCES OF ERROR • Low perfusion state • Ambient Light • Delay in reading of about 12 seconds • Methylene blue and indigo carmine underestimate the saturation
SOURCES OF ERROR • Dysfunctional hemoglobin • Carboxyhgb leads to overestimation of sats because it absorbs at 660nm with an absorption coefficient nearly identical to oxyhgb
SOURCES OF ERROR • Methgb can mask the true saturation by absorbing too much light at both 660nm and 940nm. Saturations are overestimated, but drop no further than 85%, which occurs when methgb reaches 35%.
Summary • HbF No significant clinical change • Meth Hb False low or high readings • COHb False High readings • Sulph Hb Not a clinical problem • Bilirubin Not a clinical problem
Methylene Blue False low reading • Indocyanine green False low reading • Anaemia Contraversial