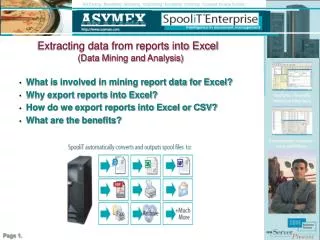
Use Case: Extracting Performance data from OnCommand using APIs
This document outlines the process for extracting and storing performance data from multiple storage controllers (NetApp and others) using OnCommand APIs. It covers the scope of work, environment setup, and practical implementation techniques including performance collection methods and SLA definitions. Implementation examples illustrate how to use the NMSDK APIs to collect data across ~30 NetApp systems, with a focus on CPU, Disk, and LUN latency statistics. A dashboard showcasing SLA violations will also be discussed, providing critical insights for performance monitoring.

Use Case: Extracting Performance data from OnCommand using APIs
E N D
Presentation Transcript
Use Case:Extracting Performance data from OnCommand using APIs Arda Oral - Professional Services Engineer
Agenda • Scope of Work • Environment • Performance Collection • Implementation – The Theory • Implementation – The Praxis (Demonstration) • SLA Thresholds • Dashboard
Scope of Work • Customer wants to retrieve and store performance data of all storage controllers (NetApp and other vendors) in his common “performance database” • Customer defines SLAs to theperformancevalues. SLA violationsare to beimportedintothedatabase • Dashboard presenting SLA violations
Scope of Work • Oncommand „Performance Advisor“ responsible for data collection • Performance data is stored in internal Sybase database • NMSDK APIs used to access Oncommand Performance data
Environment • ~ 30 NetApp Storage Systems • OnCommand5 on a Windows 2008 Server • Oracle10 Database on AIX 5 (Performance DB)
Environment Windows 2008 AIX 5 http,https OnCommand5 http,https NMSDK4.1 Oracle Performance DB
Performance Collection • NetAppperformancedataisbeingcollectedbythe CounterManager (CM) residing on the storage controller • CM groupsdata in objects, instancesandcounters • Data canberetrievedwith „stats“ on a storagecontroller
Performance Collection • statslistobjects(aggregate, cifs, disk, lun, volume…) • stats listinstancesobjectname: aggregate, instance: aggr1objectname: system, instance: systemobjectname: volume, instance: vol0 • stats listcountersobjectname: aggregate, counter: user_readsobjectname: system, counter: cpu_busyobjectname: lun, counter: avg_latency
Implementation – The Theory • Install NMSDK 4.1on AIX5 server • Installrequired Perl Modules (SSL,LWP…) • Check NMDSK examples (basic, advanced)../netapp-manageability-sdk-4.1/src/sample/DataFabric_Manager/API_Sample_Code/advanced/Perl/perf_counters/ • Find appropriate API: perf-get-counter-data../netapp-manageability-sdk-4.1/doc/WebHelp/index.htm
Implementation – The Theory (cont. 1) perf-get-counter-data start-time end-time sample-rate instance-counter-info time-consolidation-method object-name-or-id counter-info perf-object-counter API =Object =string/int = object-type counter-name
Implementation – The Theory (cont. 2) Command on storage system:stats show -i 1 system:*:cpu_busy
SLA Thresholds • CPU_BUSY > 90% = SLA violation • Disk_BUSY > 90% = SLA violation • LUN Latency > 20ms = SLA violation • TARGET Queue Full = SLA violation • if 10% of collected counter data exceed SLA threshold storage system counter is flagged yellow **if 20% of collected counter data exceed SLA threshold storage system counter is flagged red

