Download
1 / 8
80 likes | 213 Vues
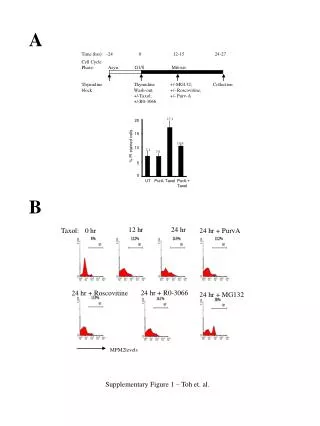
12 hr. 24 hr. Taxol:. 0 hr. 24 hr + PurvA. Time (hrs): -24 0 12-15 24-27. Cell Cycle Phase: Asyn. G1/S Mitosis. Thymidine block. Thymidine Wash-out; +/-Taxol;

E N D
12 hr 24 hr Taxol: 0 hr 24 hr + PurvA Time (hrs): -24 0 12-15 24-27 Cell Cycle Phase: Asyn. G1/S Mitosis Thymidine block Thymidine Wash-out; +/-Taxol; +/-R0-3066 +/-MG132; +/- Roscovitine; +/- Purv-A Collection 24 hr + Roscovitine 24 hr + MG132 17.1 20 15 10.6 % PI stained cells 10 7.1 7.0 5 0 24 hr + R0-3066 UT PurA Taxol PurA + Taxol MPM2levels A B Supplementary Figure 1 – Toh et. al.
Time (hrs): -24 0 12-15 24-27 Cell Cycle Phase: Asyn. G1/S Mitosis Thymidine block Thymidine Wash-out; +/-Taxol; +/-R0-3066 +/-MG132; +/- Roscovitine; +/- Purv-A Collection Taxol (24hrs) UT (0 hrs) UT (24hrs) 2N 4N 2N 4N 2N 4N 2N 4N Roscovitine PurvA MG132 R0-3066 2N 4N 2N 4N 2N 4N 2N 4N Taxol + Purv A Taxol + Roscovitine Taxol + MG132 Taxol + R0-3066 2N 4N 2N 4N 2N 4N 2N 4N Supplementary Figure 2 – Toh et. al.
M1 M1 M1 M1 M1 M1 1.9% 1.6% Released in DMEM from Thymidine-block 2N 4N 2N 4N Released in CDDP from Thymidine-block 16.7% 15.8% 2N 4N 2N 4N 15.4% 14.8% Thymidine-blocked + CDDP 2N 4N 2N 4N Supplementary Figure 3 – Toh et. al.
Control si73.1 si73.2 si73.3 si73.4 Control si73.1 si73.2 si73.3 si73.4 Control si73.1 si73.2 si73.3 si73.4 p73 gapdh H1299 A549 U2OS 25 25 UT 30 20 25 20 Taxol 15 20 15 % cleaved caspase-3 15 10 10 10 5 5 5 0 0 0 siRNA: Control p73.1 p73.2 p73.3 p73.4 Control p73.1 p73.2 p73.3 p73.4 Control p73.1 p73.2 p73.3 p73.4 A H1299 A549 U2OS siRNA: B Supplementary Figure 4 – Toh et. al.
-/- p53 -/- p73 0 6 10 24 48 60 : Time (hrs) WT 2N 4N 2N 4N 2N 4N 2N 4N 2N 4N 2N 4N 2N 4N 2N 4N 2N 4N 2N 4N 8N 2N 4N 8N 2N 4N 8N 2N 4N 2N 4N 2N 4N 2N 4N 2N 4N 2N 4N Supplementary Figure 5 – Toh et. al.
Control siRNA 1 PLK1 siRNA 1 Control siRNA 2 PLK1 siRNA 2 2N 4N 2N 4N 2N 4N 2N 4N Supplementary Figure 6 – Toh et. al.
Asynchronous MG132 UT UT MG132 3.7% 3.1% 14.8% 16.4% PI Thymidine-blocked and released UT UT MG132 MG132 4.7% 4.1% 39.6% 40.5% PI Supplementary Figure 7 – Toh et. al.
45 38.0 40 25 27.0 30 20 17.0 % cleaved Caspase-3 20 17.0 15 10 4.8 4.9 10 UT 0 UT 5 Taxol pcDNA p73a p73DD 19.3 Taxol 15.6 0 11.3 % cleaved caspase-3 7.2 2.8 1.3 DNp73b pcDNA p73a A B Supplementary Figure 8 – Toh et. al.