Demographic Forecasting for Luton using POPGROUP
240 likes | 384 Vues
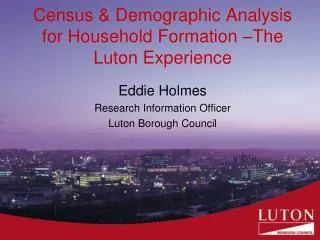
Demographic Forecasting for Luton using POPGROUP . Eddie Holmes Research Information Officer Luton Borough Council. Overview. Use of POPGROUP with migration scenarios: What Migration data to use Scenarios Household forecasts. Luton Background.

Demographic Forecasting for Luton using POPGROUP
E N D
Presentation Transcript
Demographic Forecasting for Luton using POPGROUP Eddie Holmes Research Information Officer Luton Borough Council
Overview • Use of POPGROUP with migration scenarios: • What Migration data to use • Scenarios • Household forecasts
Luton Background • Census, Luton’s population 202,300, 10% growth since 2001, 2012 MYE 205,800 • 74,300 households, with an average HH size of 2.71. Average HH size was 2.59 in 2001 • Evidence of very large households some up to 30 people • Strong population growth in urban areas • LBC considered pre 2011 MYE to be under-estimating population • High population density and limited space to build
Luton Background • High population turn-over, estimated 70% of population either not born or moved to Luton since 2001 Census • High BME Population, 55% BME at 2011 Census • Large South Asian population • High international migration –’super-diverse’ over 100 languages and dialects spoken • New East European population, over 10,000 at last Census, evidence this is not short term migration
Forecasting scenarios • Trend international migration, high international migration, net nil migration & planned house building scenarios • Luton’s fertility rates from ONS used • Standard mortality rates used • Internal migration taken from a five year average of the ONS’ MYE components of change • CLG 2011 rates used for HH forecasts • POPGROUP and POPGROUP Derived Forecasts used for population and household projections
Trend Migration • Eight year average of ONS components of change • Attempts to smooth peaks and troughs in migration, especially the rise from A8 EU Migration • Disadvantage if the shorter term trend is continued in long term e.g. greater EU migration
High Migration • Five year average – same as ONS’ methods • Skewed toward higher migration from A8 accession in the last five years • Disadvantage if a short term trend is projected into future with exceptional events e.g. recession
Net Nil Migration • Assumes net nil migration • Assumes that inward and outward migration cancel each other out
Housing Target Constrained • Looks at what happens to the population if the projections are constrained to the planned house-building in Luton • The planned housing are based on capacity for house building from land use studies • Council policy to maintain balance between housing, employment and open space • This scenario used trend migration
International Migration Data • What to use: Is ONS data fit for purpose? • Estimates from NINO registrations or Flag 4 data – is this any more accurate? • Comparing Census figures 2001 and 2011 – problem for Luton as 2001 figure was an under-estimate • Average of ONS components of change used as this was considered to be the best data available
Household Projections • Household projections were produced for the forecasting scenarios • The POPGROUP derived forecast model was used • CLG’s 2011 interim rates projected to 2031 used
HH Rate Issues • 2011 Interim rates based on pre Census 2011 migration and recession HH building, considered not fit for purpose by some • 2008 based rates based on data before the credit crunch – is this too optimistic?
Implications of forecasts • The implications of the forecasts shows that Luton doesn’t have the capacity to meet its housing needs – ‘duty to cooperate’ from other authorities • Issues with CLG rates – are they adequately capturing household formation • Issue in Luton of HH formation in poor conditions – converted sheds, garages and unsuitable accommodation • Growth in areas of town with high BME population • High growth in demand for school places • The elderly population will have the highest levels of growth • High demand for elderly and young people’s services at a time of cuts
Future Population Issues • High growth in elderly population • High growth in demand for school places • Future migration – Will it continue at same level, Romanians & Bulgarians given right to work in UK • Housing Benefit changes – already some anecdotal evidence of people moving from London to Luton because of the changes • Ward level projections • Ethnicity Projections
Concluding remarks • Overview of population & household projections within an urban area and highly diverse population • Indication of our future work at Luton • Consultancy work – we have been commissioned to do work in a more rural area with a military population - alternative scenarios based on economic forecasts • Available for forecasting and demographic work • Any questions?
Contact • Eddie Holmes • Edward.holmes@luton.gov.uk • Eddie.holmes@lutontradedservices.com • Tel: 01582 54 7093