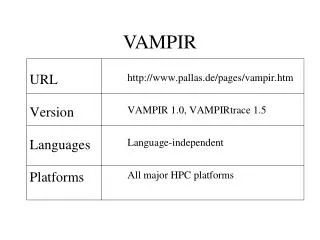
VAMPIR: Visualization & Analysis of MPI Resources
VAMPIR is a commercial tool for visualizing MPI trace data, providing a comprehensive analysis of MPI resources through a user-friendly interface. It supports MPICH and all vendor MPIs, enabling high-performance computing applications. Enhance your MPI profiling with VAMPIRtrace.

VAMPIR: Visualization & Analysis of MPI Resources
E N D
Presentation Transcript
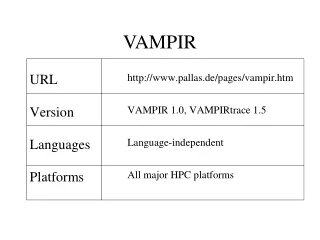
VAMPIR • Visualization and Analysis of MPI Resources • Commercial tool from PALLAS GmbH • VAMPIRtrace - MPI profiling library • VAMPIR - trace visualization tool
VAMPIRtrace • Separate Installation and User’s Guide for each supported platform • Works with MPICH and all vendor MPIs • Instrumentation done by linking your application with the VAMPIRtrace library • API for stopping and starting tracing and for inserting user-defined events into the trace file • Trace files generated by MPI processes are automatically collected and merged into a single trace file
VAMPIRtrace API • Used to start and stop tracing and to define application-specific activities • Error to call any VAMPIRtrace API routines before MPI_Init or after MPI_Finalize • To disable trace collection for the local process: • void VT_traceoff(void) • SUBROUTINE VTTRACEOFF() • To re-enable trace collection for the local process: • void VT_traceon(void) • SUBROUTINE VTTRACEON()
VAMPIRtrace API (cont.) • User-defined activities • Process states with start and stop times • Activitiy class can contain activities with different symbolic names • Start and stop routines identify activity by an integer code that is attached to the class/symbol pair by first calling a definition routine • Activity definitions are process local, but integer codes must be assigned in a globally consistent manner.
VAMPIRtrace Configuration File • Logfile-name <logfile> • Name for logfile to contain merged trace file • Logfile-rank <rank> • Rank of process that will write logfile • Internal-msgs [on|off] • Specifies whether communications internal to the MPI library should be traced
Configuration file (cont.) • Activity <act_pattern> [on|off] • Defines a filter for matched activity classes • Symbol <sym_pattern> [on|off] • Defines a filter for matched symbol names • Filter directives are evaluated in order.
Filtering Example # disable all MPI activities ACTIVITY MPI OFF # enable all send routines SYMBOL MPI_*send ON # except MPI_Bsend SYMBOL MPI_bsend OFF # enable receives SYMBOL MPI_recv ON # and all test routines SYMBOL MPI_test* ON # and all wait routines SYMBOL MPI_wait* ON # enable all activities in the Application class ACTIVITY Application ON
Default Configuration LOGFILE-RANK 0 INTERNAL-MSGS OFF ACTIVITY * ON
Limiting VAMPIRtrace Logfile Size • Limit number of events to be logged by scaling down application input files, iteration count, number of processes, etc. • Enable trace data collection for just a subset of the application’s runtime. • Use the filtering mechanism to limit the set of logged events.
Managing VAMPIRtrace API Calls • Need both instrumented and uninstrumented versions • Dummy API library libVTnull.a • Maps API calls to empty subroutines • Slight overhead • Use C preprocessor (or equivalent tool for Fortran) to guard calls to the VAMPIRtrace API using #ifdef directives
VAMPIR • Highly configurable trace visualization tool • Originally developed by Forschungszentrum Julich GmbH under name PARvis • Available for all major workstations and some SMPs and MPPs • Requires graphical display running X11R5 or later
VAMPIR Displays • Process State Display • Statistics Display • Timeline Display • Communications Statistics • Configured by using • Pull-down menus • Configuration file