Approach: Assimilation Efficiencies
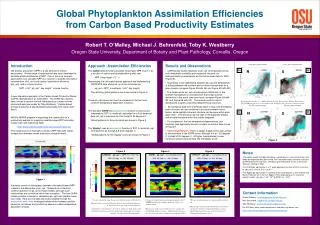
Global Phytoplankton Assimilation Efficiencies from Carbon Based Productivity Estimates. VGPM : pb_opt = poly function of sst JAN 03 (top) vs JUL 03 (bot). 8. Pb_opt (mg C / mg Chl / hr). EPPLEY : pb_opt = exp function of sst JAN 03 (top) vs JUL 03 (bot).

Approach: Assimilation Efficiencies
E N D
Presentation Transcript
Global Phytoplankton Assimilation Efficiencies from Carbon Based Productivity Estimates VGPM: pb_opt = poly function of sst JAN 03 (top) vs JUL 03 (bot) 8 Pb_opt (mg C / mg Chl / hr) EPPLEY: pb_opt = exp function of sst JAN 03 (top) vs JUL 03 (bot) CARBON: pb_opt = NPP_m.l. / (chl * DL) JAN 03 (top) vs JUL 03 (bot) 6 4 2 0 Robert T. O’Malley, Michael J. Behrenfeld, Toby K. Westberry Oregon State University, Department of Botany and Plant Pathology, Corvallis, Oregon Introduction Net primary production (NPP) is a key attribute of marine ecosystems. A wide range of approaches have been developed to estimate global distributions of NPP. One of the most common approaches is to calculate NPP as a function of satellite chlorophyll concentration (chl), an hourly carbon assimilation efficiency (pb_opt), and a volume function: NPP = Chl * pb_opt * day length * volume function A new alternative approach is the Carbon-based Production Model (CbPM) (Behrenfeld et al. 2005 GBC). The CbPM has recently been refined to resolve vertical characteristics of water column photosynthesis (see poster by Toby Westberry “Carbon-based primary production & phytoplankton physiology from ocean color data”). NASA’s MODIS program is supporting the construction of a productivity website for supplying satellite-based NPP estimates, model code, and supporting data: http://www.science.oregonstate.edu/ocean.productivity This single source of internally consistent NPP data sets makes comparisons between model predictions straightforward. A primary source of discrepancy between chlorophyll-based NPP models is the description of pb_opt. Temperature is the most common predictor of pb_opt in these models, although such relationships are correlative rather than causative. The new CbPM model provides a means for calculating pb_opt from satellite ocean color data. Here we use data and code available through the productivity web site to investigate relationships between satellite based pb_opt values and predictions based on earlier temperature-dependent models. Approach: Assimilation Efficiencies The Carbon based model calculates mixed layer NPP (mg m-3) as a function of carbon and phytoplankton growth rate: NPP_mixed layer = C * u Rearranging the chlorophyll-based approach and implementing CbPM NPP data allows pb_opt to be calculated as: pb_opt = NPP_mixed layer / (chl * day length) The resulting global patterns are shown below in Figure 2. These pb_opt values can then be compared to the two most common temperature-dependent functions: The standard VGPM uses a polynomial function of sea surface temperature (SST) to model pb_opt based on a fit to empirical data. pb_opt is maximum for this model at 20 degrees C. Global patterns for the polynomial are shown in Figure 3. The ‘Eppley’ uses an exponential function of SST to model pb_opt, normalized to go through 4.6 at 20 degrees C. Global patterns for the ‘Eppley’ curve are shown in Figure 4. • Results and Observations • CbPM-based scatter diagrams of pb_opt vs temperature show both remarkable variability and organized structure, as demonstrated by boreal winter and boreal summer data for 2003 (Figure 5). • Asymmetry in the relationship between pb_opt and temperature is striking between the northern and southern hemispheres for a given season (compare Figure 5A with 5B, and Figure 5C with 5D). • The boreal winter pb_opt-vs-temperature distribution in the northern hemisphere is consistent with the boreal summer distribution in the south (and vice versa) (compare Figure 5A with 5D, and Figure 5B with 5C). The annual month-to-month distributions progress smoothly between these extremes. • By overlaying data from the Pacific basin in blue, and the Atlantic basin in brown, we see variations in structure between these basins, while spatially coherent structure can be seen within each basin itself. This structure can be seen in the parabolic shapes and arcuate lineations within the scatter diagrams. • For comparison, the two temperature-dependent pb_opt functions (see Approach) are also overlain as red and blue curves in Figure 5. • Interesting Features:There is always a peak to the data, similar to the maximum in the VGPM curve, although it is at ~ 25 degrees C, instead of 20 degrees C. At higher temperatures it never continues upward exponentially like the Eppley curve. N S winter winter 5A 5B Points drawn in order of: all data (black); Pacific data (cyan); Atlantic data (brown). The VGPM pb_opt curve is overlaid in red; the Eppley pb_opt curve is drawn in blue. N S summer summer 5C 5D Figure 5 • Notes • The carbon model that Toby Westberry is working on is a refinement of the initial model developed by Mike Behrenfeld. The new model allows for better resolution of NPP below the mixed layer. Westberry presented initial results at the Ocean Sciences meeting in 2006. • The VGPM pb_opt function is a 7th order polynomial function of SST, in the form of: pb_opt = sum(i=0,7) ai (sst/10)**i • The Eppley pb_opt function is scaled to fit 4.6 at 20 degrees C after Antoine and Morel (1996) but left in the form Eppley (1972) originally gave his maximum growth function: pb_opt = 1.54 * 10**((0.0275*sst) – 0.07) Figure 2 Figure 3 Figure 4 Figure 1 Contact Information Robert O’Malley: omalleyr@science.oregonstate.edu Mike Behrenfeld: mjb@science.oregonstate.edu Toby Westberry: westbert@science.oregonstate.edu For NPP data, code, model comparisons, field data, etc, please see: http://www.science.oregonstate.edu/ocean.productivity Pb_opt calculated using the spectral Carbon model of Westberry. Max pb_opt observed in January off the coast of Central America; in July it is seen to the west of South America. A high degree of variation is seen from January to July, along with variation between the northern and southern hemispheres on those months. See the scatter diagrams above. Pb_opt calculated using a polynomial function of sst; AVHRR bsst files for January and July, 2003, were used for input. . Max pb_opt values are at 20 degrees C, causing the mid-latitude highs seen here. Small global variations are seen between winter (January) and summer (July). PB_opt calculated using an exponential function of sst. Max pb_opt values found at maximum sst locations, causing the pattern of equatorial highs seen here. Small global variations are seen between winter (January) and summer (July).