Comprehensive Study of Sunspot Dynamics using SOHO Instruments in Oslo
120 likes | 238 Vues
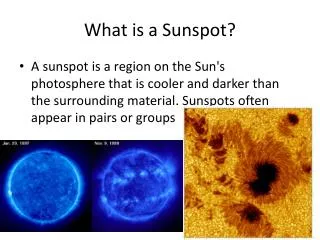
This extensive research project, led by Brynildsen, Maltby, Fredvik, and Kjeldseth-Moe at the University of Oslo, focuses on the interactions in the transition region and corona above sunspots. Utilizing SOHO instruments since May 1996, the study observes over 115 sunspots to analyze fast downflows, oscillations, and plumes in the sunspot chromosphere. It combines intensity and velocity maps with data processing and comparative analysis using various astrophysical tools. Results are shared through papers, talks, and various scientific communications.

Comprehensive Study of Sunspot Dynamics using SOHO Instruments in Oslo
E N D
Presentation Transcript
Sunspot Studies in Oslo Nils Brynildsen, Per Maltby, Terje Fredvik and Olav Kjeldseth-Moe Institute of Theoretical Astrophysics University of Oslo
Program History • Sunspot studies with SOHO instruments from 05/1996 • Purpose: To study the transition region and corona above spots, particularly the fast down flows into sunspot umbrae observed with HRTS • Extended to sunspot plumes, and 3 min oscillations in the sunspot chromosphere and transition region • O_SPOT – studies run between May 1996 and present • A total of 115 spots observed on 190 days • All O_SPOT data are processed into intensity and velocity maps • Results presented in papers, talks, posters and proceedings
Oslo Sunspot Studies O_SPOT1 – raster of (4) wide slit images at three wavelengths O_SPOT2 – limited spatial extent, but many lines, reasonably high cadence raster O_SPOT3 - coarse raster to replace O_SPOT1 O_SPOT4 - a “sit and stare” study for rapid time variations O_SPOT5 - large FOV, reasonable cadence, raster (incomplete area coverage, stripes) --------------------------------------------- O_SPOT10 – GIS study for sunspot oscillations O_SPOT11 – NIS study for sunspot oscillations
Oslo Sunspot Studies (2) Study Spectro- Slit Step Number of FOV of Exp. Cadence Name meter # size Locations/ one rst. time (duration) (as) Rasters (as^2) (s) (m:s) ============================================== O_SPOT1 NIS 6 50 4/4 240x240 10 2:04 O_SPOT2 NIS 4 2 60/1 120x120 20 22:36 O_SPOT3 NIS 5 8 30/1 240x240 8 6:20 O_SPOT4 NIS 3 drift 150/1 4x51 5 20:30 O_SPOT5 NIS 4 4 60/1 240x240 10 26:30 ---------------------------------------------------------------- O_SPOT10 GIS 2 drift 145/6 11x4 17 45:50 O_SPOT11 NIS 4 drift 250/1 13x120 10 60:00 ============================================== Studies marked drift have step size 0 arc-sec. and no rotational comp. Number of locations marks number of exposures defined as a single raster Solar drift rate x raster duration defines extent of raster in x-direction
Wavelength list Ion l (Å) T(K) #1 #2 #3 #4 #5 #10 #11 ===================================== He I 522 10 000 x He I 584 10 000 x x x x F x O III 599 95 000 x x x u O VI 554 175 000 x x x x l x O V 629 240 000 x x x x x l x Ne VI 562 430 000 x x x x Mg VIII 315 810 000 x G Mg IX 368 960 000 x x x x x I x Fe XIV 334 1 900 000 x S Fe XVI 360 2 700 000 x x x x
- A 50 arc sec overlapping area, with ~30 s and ~2 min cadence - Clear and significant changes over 5 min time periods. Also perceptible changes over time spans of ~2 min.
Mapping of • plumes • - Located above the • white light spot • - I > 5 x <I> i.e. • yellow contour • - Max visibility at • 0.25 MK – do not • occur in corona, • i.e. cool • - Down flows into • the spots in TR • - No corresponding • up-flows • - No systematic • flows in corona • Up-flows in • extended area? • (large raster)
Data reduction of O_SPOT data All CDS data are corrected using standard CDS software, transformed to absolute intensity, and processed may encompass the following: -- Intensity and velocity maps from line profiles fitted to Gaussians. Blends removed before fitting. -- Routines for conditional probability analysis used on selected emission lines. -- Power spectra of relative integrated line intensities calculated for spectral lines to study the 3 minute oscillations. -- CDS data are often co-aligned and compared with data from SUMER, MDI or TRACE.