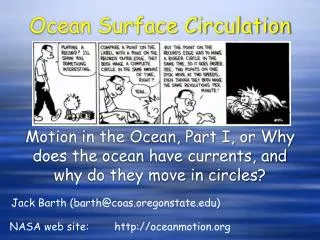
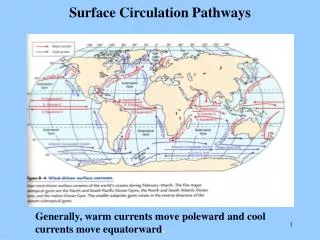
Surface Circulation Pathways
Surface Circulation Pathways. Generally, warm currents move poleward and cool currents move equatorward. Effect of Ocean Heat Transport. Pattern of currents flow impacts sea surface temperatures and, as a result, air temperatures over land. Equatorial Pacific: Sea Surface Temperature (SST).

Surface Circulation Pathways
E N D
Presentation Transcript
Surface Circulation Pathways Generally, warm currents move poleward and cool currents move equatorward.
Effect of Ocean Heat Transport Pattern of currents flow impacts sea surface temperatures and, as a result, air temperatures over land.
El Nino Effects on Winter Air Temperatures in US Temperature anomaly is plotted (Tobsv’d – Tmean)
Effect of El Nino on Anchovy Catch Declines in fish catch correlate with El Nino events (red spikes).
Atmospheric CO2 Budget 1990s 1015 gm C yr-1 • Fossil Fuel Combustion 6.3±0.4 • Deforestation 1.7±1 • Total Human CO2 Source 8.0±1.1 • Atmospheric CO2 Accumulation 3.2±0.1 • Ocean CO2 Uptake 2.0±0.4 • Terrestrial CO2 Uptake (bydifference) 2.8±1.1 Total CO2 Sink 4.8±1.5
Anthropogenic CO2 Distribution in the Ocean CO2 from fossil fuel combustion that has been absorbed by the ocean is found mostly in the upper 1000m.
Photosynthesis Rates in the Ocean(satellite based estimates) Where are the highest (red/yellow) and lowest (blue) photosynthesis rates found in the ocean?
Depth vs Pressure Density vs Temperature Density vs Pressure
Density has non-linear dependence on T and S Range in T, S and σ in the ocean
Dependence of temperature of maximum density and freezing point of seawater on salinity Implies that cooling seawater with S<25 reaches the temperature of max density before the freezing point.
Depth Profiles of Temperature 0 10 20ºC 63ºS 7ºS
Sea Surface Temperature (SST) (ºC) Most of surface ocean is warm. Only few regions at high latitudes where surface ocean temperatures approach temperatures in the Deep Sea.
Surface Solar Radiation (Watts/m2) The equatorial region with highest solar radiation rates corresponds to the warmest SSTs.
Sea Surface Density and SST: Pacific Ocean Potential Density The pattern of surface density closely follows the pattern of SST (but not surface salinity).
Spatial variations of density- surface vs 3000m Potential Density 50m Potential Density 3000m Water is denser and more uniform in Deep Sea than surface ocean. Only near Antarctica in Pacific Ocean does surface potential density approach that of deep sea.
Cross Section of Density (σθ) Pacific Ocean Depth (m) Latitude