Download
1 / 22
230 likes | 374 Vues
95 Express & Ramp Metering Miami, Florida. Transpo 2012 The Future of Traffic Incident Management, October 30, 2012 Javier Rodriguez, P.E., ITS Operations Engineer Joe Snyder, TMC Manager FDOT District Six. Project Overview Scope. Legend. Phase 1a. Phase 1b. Phase 2.

E N D
95 Express & Ramp Metering Miami, Florida Transpo 2012 The Future of Traffic Incident Management, October 30, 2012 Javier Rodriguez, P.E., ITS Operations Engineer Joe Snyder, TMC Manager FDOT District Six
Project OverviewScope Legend Phase 1a Phase 1b Phase 2 Fort Lauderdale • Phase 1 Complete • NB – Dec. 2008; SB – Jan. 2010 • HOV to HOT Conversion • 1 HOV Lane 2 Express Lanes • Congestion-Priced Tolling • Ramp Signaling • Express Lanes Operations FY 11/12 • 62,700 Average Weekday Trips • 57 MPH (NB) • 62 MPH (SB) • 1,693 Closure Events in EL GGI Miami Phase 1 is complete and Phase 2 will be completed during the next 2-3 years.
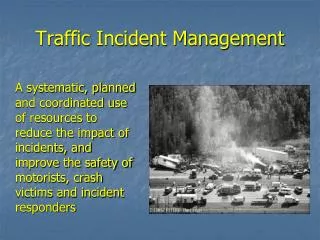
Incident Management PlanDevelopment Operational Risk Assessment Incident Management Workshops Follow-up Meetings with Agency Partners Developed protocols/agreements Developed quick clearance procedures Video sharing opportunities Updated for Phase 1B (SB) Opening FDOT District Six Team held numerous workshops in preparation for project launch.
Incident Management Plan- Resources: TMC Operators TMC 95 Express Lane Operators Specially Trained EL procedures Central Contact Point for Agency Coordination & Dispatchers for Incident Response Operators Express Lanes Operators needed to evolve from traffic managers to travel demand managers.
Incident Management Plan- Resources: Road Rangers I-95 Road Ranger Service Patrol Specially Trained Staged Flatbed Tow Trucks, North & South Ends Weekday Daytime – 7 RR; Nighttime – 4 RR Weekend Daytime – 4 RR; Nighttime – 4 RR Road Rangers are staged along I-95 for faster response and clearance.
Incident Management Plan- Resources: Others Additional Incident Responders Additional FHP Trooper (6am – 10pm, M-F) Incident Response Operators (5:30am to 9:30pm, M-F) Coordinates FDOT resources Specially Trained Incident Response Vehicles Specially Equipped IRV Truck Flatbed Tow Truck Incident Managers work together to clear event along northbound I-95.
Incident Management Plan- Resources: Outreach & Training Multi-Agency Coordination One-on-One Meetings Post Incident Analysis Multi-Agency Training; MOT, Procedures Recurring Effort
Incident Management PlanProcedures Road Rangers FHP support for Road Rangers to cross double white lines and delineators for incidents Disabled Vehicles Quickly/safely relocated to designated area Abandoned Vehicles Expedite logging the initial discovery FHP Trooper “sweeps” the 95 EL daily Procedures were developed to ensure efficiency and safety on the field.
Incident Management PlanProcedures Staging Strategic Locations 5AM – 1 PM: Park & Ride Lot, 95 Street SB On-Ramp 1PM – 9PM: Park & Ride Lot, SR 112 Toll Plaza 9PM – 5AM: Park & Ride Lot Relocation Crash Investigations Motorist Assistance Park & Ride Lot Staging Area SR 112 Toll Plaza Staging Area
Incident Management PlanProcedures Closure Procedures Less than 30 minutes – Post “Closed” 30 to 60 minutes – Road Rangers 60 minutes plus – Asset Maintenance Contractor DMS Strategies MOT Resources
Incident Management PlanProcedures Developed New MOT Plans Within EL Redirection Buses CRASH IRV X RR Remove Delineators Daily Average 0.6
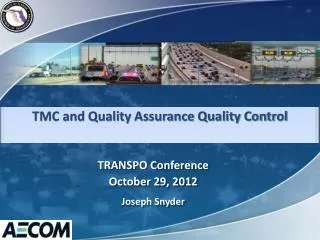
Ramp Metering for Incident Management Miami, Florida Transpo 2012 The Future of Traffic Incident Management, October 30, 2012 Joe Snyder, FDOT District Six TMC Manager, AECOM
Ramp Metering - Overview • Ramp Signals • Regulate Ramp Traffic; Improve Highway Flow • Support Incident Management Efforts • Follow 95 Express Project Limits; 12 SB; 10 NB • Dedicated CCTVs for Operations, Ramp Monitoring Diagram of Ramp Metering System Components Video of Ramp Metering in Action
Ramp Metering - Operations • Typical Operation Timeframes • NB -PM Peak (3:00 p.m. - 7:00 p.m.) • SB -AM Peak (6:30 a.m. -10:00 a.m.) • Ramp Signal Operations is Subject to Traffic Conditions • Incident Management • Resources • Two Dedicated Operators • One Engineering Supervisor • 30+ Dedicated CCTVs
Ramp Metering- Operations * Dedicated CCTV for Operations Signal Overview Intersection
Effect of Ramp Signal Operation during Special Event Marlins Baseball Game on Monday April 02, 2012 5:50 PM No Congestion I-95 Southbound I-95 N OF NW 32 ST I-95 N OF NW 151 ST Express Lane Average Speed General Purpose Lane Average Speed Threshold Speed (50 mph)
Effect of Ramp Signal Operation during Special Event Marlins Baseball Game on Monday April 02, 2012 5:53 PM Congestion Started to Develop I-95 Southbound I-95 N OF NW 151 ST I-95 N OF NW 32 ST Express Lane Average Speed General Purpose Lane Average Speed Threshold Speed (50 mph)
Effect of Ramp Signal Operation during Special Event Marlins Baseball Game on Monday April 02, 2012 6:10 PM Congestion I-95 Southbound I-95 N OF NW 151 ST I-95 N OF NW 32 ST Express Lane Average Speed General Purpose Lane Average Speed Threshold Speed (50 mph)
Effect of Ramp Signal Operation during Special Event Marlins Baseball Game on Monday April 02, 2012 6:15 PM Ramp Signal 15-22 were turned on RMS 17 RMS 19 RMS 20 RMS 15 RMS 16 RMS 21 RMS 18 RMS 22 I-95 Southbound I-95 Southbound I-95 N OF NW 151 ST I-95 N OF NW 32 ST Express Lane Average Speed Express Lane Average Speed General Purpose Lane Average Speed General Purpose Lane Average Speed Threshold Speed (50 mph) Threshold Speed (50 mph) Sample of Operation
Effect of Ramp Signal Operation during Special Event Marlins Baseball Game on Monday April 02, 2012 6:25 PM Ramp Signals under Operation: Congestion Dissipated I-95 Southbound I-95 N OF NW 151 ST I-95 N OF NW 32 ST Express Lane Average Speed General Purpose Lane Average Speed Threshold Speed (50 mph)
Results – FY 11/12 EL Closed due to Incidents 2% of time Travel Lanes Blockage Duration Express Lanes: 14 min NB, 13 min SB District wide: 27 min Volumes Increased 5% NB, 7% SB 50 Million Trips 95 Express Transit Usage Increased 32% The Incident Management Plan has contributed to the overall success of 95 Express.
Questions Safety First: Buzzed Driving is Drunk Driving! Thank you, Javier Rodriguez, PE, FDOT District Six Intelligent Transportation Systems Operations Engineer javier.rodriguez2@dot.state.fl.us; 305-640-7307 Joe Snyder, FDOT District Six TMC Manager, AECOM; 305-640-7304 joe.snyder@sunguide.org www.95express.com