Download
1 / 6
60 likes | 164 Vues
WA Breeding Industry Successes and Challenges. Peter McGauran 2011. 2007 Perth Cup. Key Breeding Indicators. The WA industry represents around 10% of Australia’s foal crop.

E N D
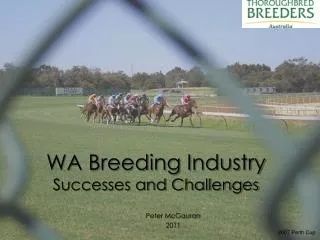
WA Breeding IndustrySuccesses and Challenges Peter McGauran 2011 2007 Perth Cup
Key Breeding Indicators • The WA industry represents around 10% of Australia’s foal crop. • In 2010, there were 900 breeders registered in WA. A fall of 21% from 2006 compared to the fall across Australia of 36%. • The number of mares available to be served in WA in 2010 was 3,000. A fall of 12% from 2006 compared to the fall across Australia of 28%. • The predicted foal crop for WA in 2010 is 1,660 (a reduction of 10% on 2006). Australia’s foal crop in 2010 is predicted to be 16,600 (a reduction of 13% on 2006). • Currently, there are 89 stallions in WA led by Oratorio (AUS) at a fee of $33,000. In 2006, there were 93 stallions in WA. Across Australia, the number of stallions has fallen 14% to 772 over the same period. • There is significant adjustment underway in the Australian industry with WA being at a slower rate than nationally.
Stallion Economics • Services fees across Australia have gone through a correction since the GFC, particularly at the top end of the market. • WA has moved against the trend. • The average service fee in WA has increased from $4,300 to $8,300 in four years. • The average fee in Australia in 2010 was $21,300, so there is scope for more growth in WA. • WA has doubled its share of the stallion market from 2.3% to 4.2% in the last 4 years. • The increase in service fees and the reducing number of foals points to breeders choosing quality over quantity. WA bred Scenic Blast wins the Gr1 Kings Stand S at Royal Ascot
Yearling Sales • In 2010, there were 4,830 yearlings sold across Australia. • 9% of these were sold in WA (440). • The WA yearling sale in 2010 grossed $14.3 million representing 5.6% of all yearling sales, an improvement of 4% from 2000. 2011 Sale Topper by Elusive Quality. $240,000 • The average sale price in 2010 was $32,600 and in 2011 was $32,300. • The growth in average sale price in WA since 2000 is 55%. • Across Australia, it has been a 36% growth in sale average price in the last 10 years to $53,000 in 2010. • WA has grown faster than the rest of Australia, but is behind the average sale of $53,000.
Yearling Buyers • Local buyers contribute the majority of the spend in WA with 73% of the gross sales in 2011. • Interstate buyers spent $2.4 million in 2011 (consistent with 2010). • International buyers spent $1.1 million in 2011; down from $2.2 million in 2010. • The main growth has come from local buyers.