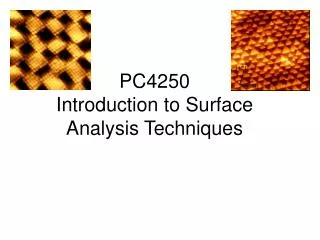
Surface Analytical Techniques
Surface Analytical Techniques. Dimitre Karpuzov Alberta Centre for Surface Engineering and Science, Univ. of Alberta. Contents. Introduction Fundamentals and Instrumentation Typical applications Practical steps and procedures Comparison of main parameters and limitations Conclusions.

Surface Analytical Techniques
E N D
Presentation Transcript
Surface Analytical Techniques Dimitre Karpuzov Alberta Centre for Surface Engineering and Science, Univ. of Alberta
Contents • Introduction • Fundamentals and Instrumentation • Typical applications • Practical steps and procedures • Comparison of main parameters and limitations • Conclusions
What is surface? • - interface plane • - top atomic layer • - top few nanometers • - 0.1 – 1 micron • - few microns
Contents • Introduction • Fundamentals and Instrumentation • Typical applications • Practical steps and procedures • Comparison of main parameters and limitations • Conclusions
Irradiation of surfaces with beams of electrons, ions or photons • Emission in vacuum: electrons, ions, neutrals, photons incl. X-rays • Surface phenomena: scattering, sputtering, desorption, migration, topography changes, surface reactions • Bulk effects: heating, radiation damage, direct/recoil implantation of impurities, radiation-enhanced diffusion
Instrumentation • Vacuum equipment: oil-free pumps (DPH, TMP, ISP) to provide <10-8-10-10 mbar, SS chambers, valves, gauges • Sources: electron (TE e.g. LaB6, FE), ion (LMIS, EI), X-ray (Al, Mg, synchrotron; monochromator) • Beam optics: electrostatic/magnetic lenses, apertures, deflectors • Analyzers: magnetic sector, electrostatic (RFA, CMA, HSA), quadropole, reflectron (time-of-flight) analyzers • Detectors: channel detector / MCP (MicroChannel Plate), scintillator, photomultiplier • Electronics: amplifier, discriminator, integrator, A/D converter, workstation/PC
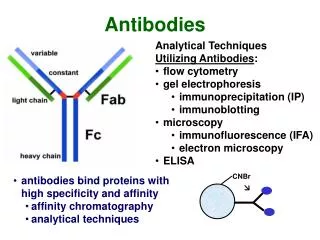
Applications • Available information - Composition incl. lateral and depth distribution - Chemical Bonding - Atomic arrangement / Surface Imaging • Typical use: examples for XPS, SIMS, AES usage • - microelectronics • - catalysis • - corrosion science • - polymers • - painting • - metallurgy
X-ray induced electron emission AES XPS Ep = hν Ek = hν – Eb – eΦ Ek (KL1L2,3) = E(K) – E(L1) – E*(L2,3)
Inelastic Mean Free Path of electrons in solids, λ; Sampling depth is ~3 λ
XPS Spectrometer (Kratos Ultra) • Spectral Mode • Standard input lens • Electrons are dispersed between the inner and central hemisphere, using standard spectrometer • Common detector plane
XPS Spectrometer (Kratos Ultra) • Image Mode • Standard input lens • Electrons pass through the central hemisphere into the outer HSA & back to the detector • Parallel image maintained • Fast, real time image
XPS: Composition of surface layers, incl. lateral distribution
XPS: Depth Distribution of Composition Alternating etching by ion beam sputtering and collection of XPS yield for selected elements allows to construct depth distribution of their concentrations
XPS: Thickness of Homogeneous Surface Layer High resolution Al (2p) spectrum of an aluminum surface. The aluminum metal (Im) and oxide (IOx) peaks are used to determine oxide thickness (d), in this case 3.7 nm using the relationship d = λOx sin α ln [ NmλOx IOx / NoλOx Im) ]
Angle Resolved XPS: Thickness/Shallow Depth Distributions d = 3λ sin α Isub (α) = Isub (0) x exp(- d/λ sin α ) Iox (α) = Iox (0) x [1 - exp(- d/λ sin α )] HR spectra at various angles can be used to construct depth distributions of thin layer components, in this case SiO2
XPS of Polymers Carbon peak C 1s can be used to identify polymers as well as their modification, in this case following air plasma treatment.
XPS: Imaging of 5 um copper bars 2.2 um edge
Technique: Secondary Ion Mass Spectrometry SIMS Characteristics: Basic Phenomena: SputteringPrimary beam: ionsSignal Measured: Secondary ions/electrons • detection of all elements • isotope sensitivity • chemical information via molecules, fragments, clusters • small information depth(1-3 ML) • high lateral resolution (60-100 nm) • low detection limit (ppm-ppb) • destructive (in Static mode < 1%)
Flight Tube with Reflectron Sputter Gun Ga Gun Heat/Cooling Stage • Load Lock • for samples • up to 8” 5 Axis Sample Manipulator Load Lock Cold Finger The TOF-SIMS IV Instrument
SIMS: Dual Beam Depth Profiling • Analysis: (SI generation) • high energy beam, fine focus • Þhigh mass resolution • Sputtering:(crater formation) • low energy beam • increased SI yield • free choice of ion species • Þhigh depth resolution
Sum of aliphatic HC Si oil Sum of aromatic HC Mass 58 (C3H8N) Mass 124 (C8H14N) Sumof Chimassorb TOF-SIMS Applications TOF SIMS Surface Chemical Composition and Trace Analysis Depth Profiling and Surface Imaging
Log Scale Linear Scale Ultra-Shallow Depth Profiles of B Implants in Si wafer 1000A Si cap, 4 × (100A 5×10¹⁹ B/cm3, 200A Si)
ToF SIMS: Imaging of Surface Components Paint Failure Analysis Example: Crater in Car Paint lubricant(from transport line) clearcoat (Sample provided by BASF Coatings AG, Germany)
SIMS Imaging: UofA logo Etching with Ga-gun Analyzing the area with Ga-gun Collecting Si mass Collection of all other masses
TOF-SIMS HC Bunching Mode Burst Alignment Mode TOF-SIMS & XPS Images of Monel 400 Corrosion Pit Backscattered SED Image Imaging XPS - Cu2O
Auger Electron Spectroscopy (AES) Instrumentation: FE Scanning Auger Microscope • Field emission electron gun • HSEA and retarding lens • Sputter gun for depth profiles AES Applications: • Contamination - at surface, grain boundaries, in bulk • Chemical species, nature of particulates, grains etc. • Chemical state maps, depth profiles or line scans • Cross-sectional depth profiles • Large Area Mapping (15 mm x 15 mm)
AES: Chemical State Map of Cuo vs Cu2O (DE = 0.9 eV) Cu2O Cuo Red = CuoGreen = Cu2O SEM
AES: Depth Profiling HR AES Directly Reveals the Chemical Difference between Si0, Si3N4 and SiO2
Contents • Introduction • Fundamentals and Instrumentation • Typical applications • Practical steps and procedures • Comparison of main parameters and limitations • Conclusions
Practical steps and procedures • selection of appropriate technique • sample preparation • mounting and loading • selection of instrument parameters • collection of data • data processing • data analysis
Introduction Fundamentals and Instrumentation Typical applications Practical steps and procedures Comparison of main parameters and limitations Conclusions Contents
Surface Analytical Techniques: Summary • -
CONCLUSIONS • There is a number of surface analytical techniques available • Careful planning is the key of success • Vast majority of techniques are qualitative. Analyzing standard specimens along with your samples is highly recommended • The results can easily be misinterpreted. Compare with databases and other publications • Check with alternative technique if possible
UoA Library Books on Surface Analysis Techniques • D. Briggs and M.P.Seah (Eds), “Practical Surface Analysis”, Wiley, 1990. • ASM Handbook, v.10, “Materials Characterization”, ASM Internat., 1990. Available also online http://www.library.ualberta.ca/databases/databaseinfo/index.cfm?ID=3272 • A.W.Czanderna (Ed.), “Methods of Surface Analysis”, Elsevier, 1975. • H. Bubert and H.Jennet (Eds), “Surface and Thin Film Analysis, Wiley, 2002. • D. Briggs, “Surface Analysis of Polymers by XPS and Static SIMS”, Cambridge Univ. Press, 1998. • J.C.Vickerman and D. Briggs, “ToF SIMS: Surface Analysis by Mass Spectrometry”, Surface Spectra, 2001. For interent links visit our website: www.ualberta.ca/ACSES
MORE SLIDES COMPLEMENTING THE 1 HR PRESENTATION FOLLOW. Note that the experimental results above are intended for illustration and not for publication. They include our own measurements as well as graphs from other sources. Their permission to have them posted here is gratefully acknowledged.
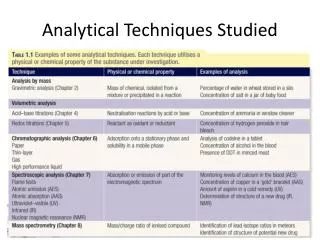
Techniques for Characterization of Materials • Optical Methods (Optical Emission / Adsorption / Fluorescence incl. Infrared and Raman Spectroscopy) • Electrochemical and Radiochemical Analysis, Chromatography • Metallographic Techniques • Resonance Methods (Electron Spin / Ferromagnetic / Nuclear Magnetic Resonace, Moessbauer Spectroscopy) • X-Ray and Neutron Diffraction / Scattering • Electron Optical Methods (TEM. SEM, EDS,LEED) • Electron or X-Ray Spectroscopies (AES, XPS, UPS, EELS) • Methods Based on Ion / Atom Emission (Ion Microscopy, ISS, RBS, SIMS)
Principles of Time of Flight Mass Spectrometry • Secondary ions are created using a pulsed primary ion beam. • The time of the pulse is short (< 1 ns) – all the secondary ions enter the flight tube at the same time. Each pulse produces a full mass spectrum. • Secondary ions are extracted into the flight tube by applying a potential difference. • All ions enter the flight tube with the same kinetic energy. • The reflectron consists of an electric field used for energy focusing. • The flight time varies directly with the m/z ratio – the higher the mass, the larger the flight time.
2) Dual Source Column (DSC) Gun 1) Dedicated 3 lens Ga Gun - Mainly used as the low energy sputter gun in DUAL BEAM PROFILE MODE - Analysis option allows use as a pulsed primary ion gun: Ar+, Xe+, Kr+, O2+,SF5+, Cs+ … - strong improvement in high mass fragment and M ion production --> greater sensitivity - Can use as an EI imaging gun; 5 - 10 micron spot. 100 nm spot 50 pA DC 250 nm spot 1 nA DC 0.6 ns pulse 25 nA Primary Ion Beams
sample flight tube reflector » » detector Time focusing by different flight paths for different SI energies SI with same mass lower energy higher energy Reflectron
Charge Neutralization Pulse Sequencing Electrons created in a flood gun react on local charge build-up. Primary ion pulse Extraction voltage Electron flood gun High mass resolution, peak identification and exact mass measurement can be obtained for non-conducting samples.