Labor Demand Elasticities
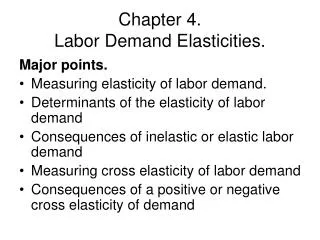
Labor Demand Elasticities. Own-Wage Elasticity. Review of the concept of elasticity in product markets Own-wage Elasticity = percentage change in labor demanded/percentage change in wage η ii = %ΔL i /%ΔW i

Labor Demand Elasticities
E N D
Presentation Transcript
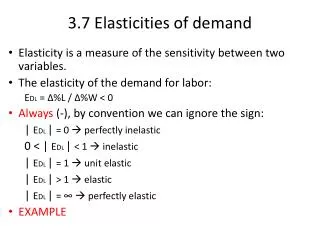
Own-Wage Elasticity • Review of the concept of elasticity in product markets • Own-wage Elasticity = percentage change in labor demanded/percentage change in wage ηii = %ΔLi/%ΔWi • The own-wage elasticity is negative and often elasticities are referred to as the absolute value of the above expression.
|ηii| > 1 Elastic %ΔLi > %ΔWi • |ηii| = 1 Unit Elastic %ΔLi = %ΔWi • |ηii| < 1 Inelastic %ΔLi < %Δwi • Graphical illustration of elasticity • Straight-line demand curve and changing elasticity • Boxes • Relative elasticities
Hicks-Marshall Laws of Derived Demand • The own-wage elasticity is related to: • Price elasticity of demand for the product • Length of time for adjustment • Substitutability of inputs • Technology • Institutional • Elasticity of supply of other factors • Labor’s share of total cost
Estimates of Labor Demand • Short-run vs. long-run elasticities • Short-run → Scale effect • Long-run → Substitution effect + scale effect • Elasticities • Scale effect – hold production technology or (K/L ratio) constant • Substitution effect – holds output constant • Overall demand E\elasticity
Using ηii • If the supply curve of labor is more inelastic than the demand curve of labor • , in the long-run labor will bear the majority of payroll taxes. • Collective Bargaining • Unions will win larger settlements in industries with inelastic demand • Pilots versus attendants • Full-truck vs. partial truck industry • Unions will try to lower the own-wage elasticity • Prevent substitution of other inputs: • immigrant labor • Outsourcing • Higher minimum wages • Unions will place higher priorities on unionizing industries with inelastic demands
Cross-wage Elasticities • Cross-wage elasticity is the percentage change in demand for labor when the price of another input (usually wages in a different occupation) changes; ηjk = %ΔLj/%ΔWk • ηjk> 0 gross substitutes • ηjk< 0 complements • Caveat: gross substitutes versus complements depends upon the relative size of the substitution and scale effects.
Determining Cross-wage Elasticities • Let us use the example of foreign labor versus domestic labor, LF and LUS and WF and WUS. • We know that if the WF↓ we will get two effects: • Scale effect: WF↓ →MCQ↓ → LF↑ and LUS↑ • Substitution effect: WF↓ →(WUS/WF) ↑→LF↑ and LUS↓ • Now, if • scale < subst, then LF and LUS are gross substitutes and ηii > 0 • scale > subst, then LF and LUS are gross complements and ηii <0
So, cross-wage elasticities are determined by the relative size of the scale effects. • Scale effect increases if: • price elasticity of the product increases, and • The greater capital share of total costs. • Call centers vs. hospitals • Substitution effect increases if: • The substitutability of inputs increase, and • Skill is easily taught • The greater elasticity of supply of other substitute inputs
Results of Empirical Studies of Cross-wage Elasticities • Labor and energy and Labor and materials are substitutes but the degree of substitutability is small • Skilled and unskilled workers are substitutes • The relationships between capital and skilled and unskilled workers is not clear, but: • It appears that skilled workers are much more likely to be complements with capital, and • If skilled and unskilled workers are substitutes the degree of substitutability of capital for skilled workers is less than for unskilled workers • Given that the price of high-tech capital has been falling, the above indicates that: • Skilled labor is more likely to be a gross complement of capital, so as C↓ → demand for skilled labor↑ • Unskilled labor is likely to have a higher own-wage elasticity of demand, so as C↓ → demand for unskilled labor will ↓
Policy Implications • Foreign outsourcing: • in the short-run and for easy to teach jobs that can be performed by unskilled workers (read partly as lacking in familiarity with US culture), LF↑ and LUS↓ • In the longer-run, as WF↑, as is occurring in India, the tendency to outsource will subside.
Federal minimum wage: • Fair Labor Standards Act of 1938 • Minimum wage is in nominal terms • Prior to 1980, it was about 45% of the wage in manufacturing, but since wages in manufacturing have gone up (remember EROP and productivity gains) it is averaging below 40%.
Figure 4.3 Federal Minimum Wage: Level, and Relative to Wages in Manufacturing, 1938–2000
Uncovering the Effects of the Minimum Wage • Economic theory predicts that the minimum wage will likely create unemployment among the unskilled. The challenges to testing this theory are • Nominal versus real wages • Inflation • Regional differences • Ceteris Paribus??? • demand shifts • supply shifts • Covered vs. uncovered sectors • Increases in coverage • Non-compliance • Increased employment and lower wages in non-covered • Intersectoral shifts in demand • State minimum wage laws
Figure 4.4 Minimum Wage Effects: Growing Demand Obscures Job Loss
Figure 4.5 Minimum Wage Effects: Incomplete Coverage Causes Employment Shifts
On the One Hand and on the Other Hand • Overall, results from minimum wage studies appear to be inconclusive • New studies seen to indicate that the demand for teenage workers in the fast food industry are between .2 and .6. • Interestingly, this is below, not above, the overall unit elasticity of the demand for labor. • This may indicate the presence of monopsony power in the market for teenage labor. • Now, if the demand for teenage elasticity is inelastic, as the minimum wage increases the total amount paid to teenagers should increase. Evidence from the 1980’s suggest this but newer evidence from the 1990’s shows no reduction in poverty among teenagers. • The minimum wage appears to only affect about 20% of the families in poverty, so it effectiveness in lowering poverty appears to be limited.
Technological Change and Labor Demand Elasticity • Technological Change • Product demand changes • New products → shifts in labor demand • Elasticity of product demand → change is elasticity of demand • Production process changes towards capital • New technologies → lower the effective price of capital • Lower capital prices → scale and substitution effects • The size of these effects determines if capital and labor are gross substitutes or gross complements • Evidence suggests that skilled labor is more likely to be a gross complement and unskilled labor is more likely to be a gross substitute for capital • Technological change may affect the mix of skilled versus unskilled but it likely has no effect on overall employment in the long-run. It does, however, lead to economic growth and most likely to increases in economic welfare.