Comparative Approaches to Ecosystem Analysis: Concepts, Models, and Applications
570 likes | 596 Vues
Explore the anatomy of comparative ecosystem studies, benefits, limitations, and examples. Discover the multidimensional concept of ecosystems and its application through models and metaphors. Gain insights on long-term studies, spatial context, and theoretical integrations in ecosystem science.

Comparative Approaches to Ecosystem Analysis: Concepts, Models, and Applications
E N D
Presentation Transcript
Comparative Approaches toEcosystem Analysis Michael Pace University of Virginia
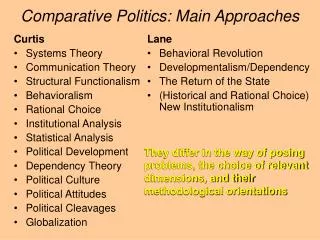
Comparative Approaches to Ecosystem Analysis • Revisiting the ecosystem concept • Approaches to ecosystems • Anatomy of a comparative study • Some benefits and examples of comparative studies • Limitations of comparative studies
The Ecosystem as a Multidimensional Concept: Meaning, Model, and Metaphor • Meaning refers to the technical definition • Scale independent, any size • Flexible any abiotic/biotic complex can be defined as an ecosystem • Model required to translate into usable form • Example energy flow food web model • Domain of model must be specified • Components • Spatial/temporal scales • Physical boundaries • Connections • Constraints • Metaphor • Scientific to stimulate thought, creativity • Social Pickett & Cadanaso 2002 Ecosystems
A) Study 1 Inputs Outputs B) Study 2 Inputs Outputs Sedimentation Burial Respiration C) Study 3 Inputs Outputs Sedimentation Burial Pace, Unpublished Textbook Chapter
Approaches Long-term studies temporal context trends and surprises Comparisons spatial context & pattern Ecosystem Science Theory integration Experiments measure responses to perturbations test mechanisms Carpenter 1998 In: Successes, Limitations, and Frontiers in Ecosystem Science
Anatomy of a Comparative Study • Nitrate export from rivers • Motivated by concerns about excess N-inputs to estuaries and coastal waters (N-budget for NY Bight) • Questions • What factors are related to NO3 concentrations and export from rivers (as inputs to coastal waters)? • Can we predict riverine NO3 concentrations? • Start with a simple conceptual model • Problem 1: measuring inputs and surrogate variables for inputs (e.g. watershed human population density) • Problem 2: considerable dedicated effort (time) needed to find and synthesize disparate measurements
Alternate Models General Questions Depict Ideas Simple Models Pattern Evaluation Communication Prediction Mechanisms Study Design Pace 2003 In: Models in Ecosystem Science
Additional Research Caraco, Carpenter, S., N.F. Caraco, D.L. Correll, R.W. Howarth, A.N. Sharpley, and V.H. Smith. 1998. Nonpoint pollution of surface waters with phosphorus and nitrogen. Ecol. Appl. 8:559-568. Caraco, N.F. and J.J. Cole. 1999. Human impact on aquatic nitrogen loads: a regional scale study of large river basins. Ambio 28:167-170. Caraco N. F. and Cole J. J. 2001. Human influence on nitrogen export: a comparison of mesic and xeric catchments. Mar. Freshwater. Res. 52:119-125. Bennett E. M., Carpenter S. R., and Caraco N. F. 2001. Human impact on erodable phosphorus and eutrophication: A global perspective. Bioscience 51:227-234. Seitzinger S.P., Kroeze C., Bouwman A.F., Caraco N., Dentener F., and Styles R.V. 2002. Global patterns of dissolved inorganic and particulate nitrogen inputs to coastal systems: Recent conditions and future projections. Estuaries 25:640-655. Caraco NF, Cole JJ, Likens GE, Lovett GM, Weathers KC. 2003. Variation in NO3 export from flowing waters of vastly different sizes: does one model fit all? Ecosystems 6:344-352.
Types, Benefits and Examples of Comparative Studies • Test questions/hypotheses: Food chain length • Compare systems similar type: Watershed nitrogen • Compare systems of different type: Herbivory • Identify scale dependencies: Lake mixing depth • Identify exceptions: Hudson River • Study of studies – Invasive species • Synthesis: Lake respiration model • Prediction: Vertical flux of organic carbon • Generality: Some ‘rules of thumb’
Food chain length • Old questions • How long are food chains? • How do lengths vary among ecosystems? • What controls length? • Many hypotheses • Primary production • Few tests • Critical problem of measurement
Background • Paper by Kaunzinger and Morin Nature1998 – “Here we show that experimental manipulations of productivity determine the length of microbial food chains in laboratory microcosms.” • Oceanographic perspective – what about the apparently long food chains of low productivity, oceanic ecosystems? For example, don’t tuna feed at the 4th to 6th trophic level? • Does ecosystem size matter?
Study of Food Chain Length In Lakes Using N-15 Isotope Trophic Fractionation • N-15 fractionates ~ 3 units for each trophic transfer; establish “trophic position” • Sampled 26 lakes ranging in size (> 106 km2) and productivity (> 102 mg TP m-3) • Established baseline of N-15 using a model to account for temporal and spatial variation in base isotope (by using long lived primary consumers from littoral and pelagic) • Established relative use of littoral and pelagic production from C-13 • Measured isotope composition of fish predators and calculated maximum trophic position Post et al. Nature 2000
Blue = Low TP Red = Medium TP Green = High TP
Conclusions and Implications • Food chain length not related to productivity • Food chain length longer in larger ecosystems • Why? In larger lakes: • New species and larger-bodied top predators • Additional species and trophic links in the middle of the food web • Possible reductions in omnivory
Compare Systems of Similar Type • Example: watershed nitrogen budgets • For a number of large eastern US watersheds that drain directly into the coastal zone • Papers from this work published in 2002 in a dedicated volume of Biogeochemistry (Vol. 57, No. 1)
Eastern Watersheds Study Goal: Sources and Exports
New N Hudson: Atmospheric Deposition = 52 % Fertilizer = 10 % N-Fixation Agriculture = 5% N-Fixation Forest = 19% N Food/Feed = 14% Boyer et al. 2002 Biogeochem.
Conclusions and Questions from Herbivory Study • Aquatic herbivory > terrestrial • Herbivory does not decline across gradients of primary production (PP) • Herbivore biomass and herbivory increase at similar rates with PP • For a given level of PP aquatic and terrestrial herbivores reach similar biomass • But aquatic herbivores remove on average 3x more PP • Why the difference? • Nutrient quality of forage (see Cebrian papers)
Scaling Relationships • One of the most critical uncertainties in ecological/environmental work • Scaling up estimates often based simply on extrapolation from specific process studies (e.g. N-fixation at a few sites to N-fixation in the ocean) • Example: mixed layer depth in lakes
Exceptions • Hudson River long-term study by scientists at the Cary Institute • Initial work focused on measuring key processes • Context for analysis came from comparative studies • Hudson often proved to be an exception, at least relative to most prior work
Cole et al. MEPS 1988 General pattern of bacterial productivity Findlay et al. L&O 1991 Hudson doesn’t fit
Study of Studies – Review of Invasive Species Papers Most studies of invasive species do not specify time of invasion. Many Done long after establishment. Most studies of invasive species are short. Few are long. Strayer et al. 2006 TREE
Synthesis • Example – respiration in lakes • A tale of dealing with annoying book editors Respiration is perhaps the best index of the flow of organic matter in aquatic ecosystems, because it integrates all the different sources of organic carbon as well as the temporal variability in its rate of supply.” Williams and del Giorgio 2005
Planktonic Data • 70 lake mean values • Dark bottle O2 consumption • North temperate lakes, primarily summer, primarily surface mixed layer • Range: 0.029 to 6.73 mmol O2 m-3 h-1
Sediment Respiration • 30 lake mean values • Core incubations, O2 consumption • North temperate lakes • Sediment respiration normalized to standard temperature (10 deg. C) • Range: 1.6 to 33 mmol O2 m-2 d-1
1.6 1.4 1.2 1 log10 SR std 10 °C (mmol m-2 d-1) 0.8 0.6 0.4 0.2 .5 1 1.5 2 log10 Total Phosphorus (mg m-3) Log SRstd = 0.17 + 0.58 log TP; R2 = 0.69
Right – but let’s have an estimate of global lake respiration so we can put it together with our other numbers for the book’s synthesis chapter (by us). Editors
Global Estimate • Use empirical equations for pelagic and sediment R • Global data on lake number and size distribution • Relationships of lake surface area with: lake abundance, depth, productivity
Implications of Estimate • Global lake R (62 Tmol C y-1) is similar to (within 2x) of global R for rivers and estuaries • Global lake R is << global ocean and terrestrial R (each ~ 10,000 Tmol C y-1) • Global lake R > GPP (~ 54 Tmol C y-1) • Difference (8) ~ global CO2 evasion of 12 Tmol C y-1 (Cole et al. 1994) • Large lakes R especially in deep waters is poorly known Pace and Prairie 2005 In: Respiration in Aquatic Ecosystems
Prediction • Comparative studies often produce empirical equations that summarize the process y as a function of one or several independent variables: • Y = b0 + b1*x1 + b2*x2 . . . bn*xn • These relationships can be applied to make predictions (but too seldom are)
Traditional approach to measuring sedimentation flux Novel approach Science 2007
Prediction from VERTEX program model: Pace et al. 1987 equation for vertical flux based on depth (z) and primary production (PP): POCf = 3.52 z0.73 PP1.00
Thoughts from Predictions • Buessler et al. make the case that the attenuation of flux at the two sites is different as a function of site-specific sources and processes. • Predictions from a model that includes site specific primary production partially accounts for the differences • Oceanographers should take a closer look at the scaling of flux with PP (is the coefficient =, >, or < 1?) as this might substantially affect variability of flux and sequestration