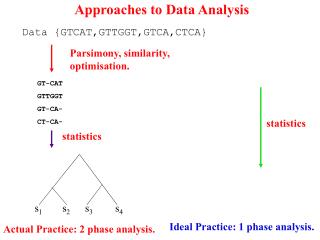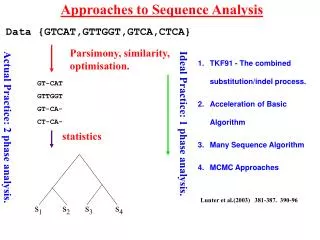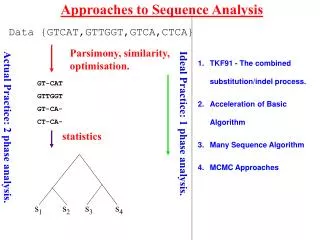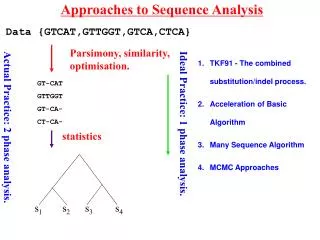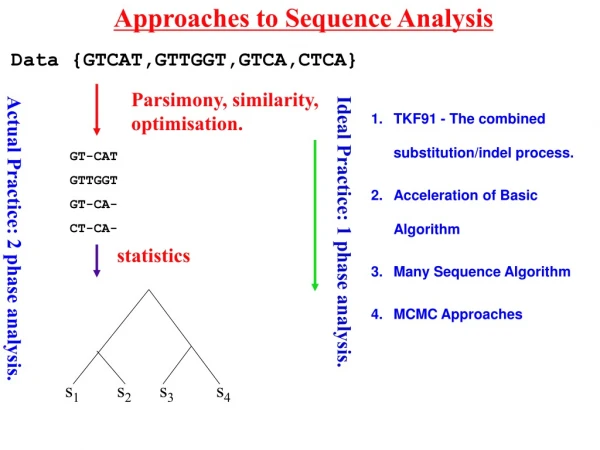
Approaches to Comparative Analysis
Approaches to Comparative Analysis. Bruce Walton All reports in MAST Log in as MASTComparative. Why compare performance?. Importance of context Identifying potential for improvement Citizens are encouraged to compare

Approaches to Comparative Analysis
E N D
Presentation Transcript
Approaches to Comparative Analysis Bruce Walton All reports in MAST Log in as MASTComparative
Why compare performance? • Importance of context • Identifying potential for improvement • Citizens are encouraged to compare • “This will allow local citizens to easily compare the performance of their area, on road safety, against other similar areas and to compare improvement rates” DfT strategy
How not to compare? • http://road-collisions.dft.gov.uk/ • Collisions by road type • “Collisions on urban or rural roads within the local authority” • No allowance for network variation • Casualties by population • “Total number of casualties per 10,000 residents of the local authority” • Typically only 67% of casualties live in HA of crash • 20 HAs have less than half, only 30 have over 80% • HAs have widely varying population sizes • Districts and/or constituencies are a better basis for comparison
How to compare? • Vehicle accident rate • “Accident rate for each type of vehicle, expressed as the number of collisions per 100 million vehicle miles of that vehicle type” • Car involved in reported injury crash every 1.22 million miles • Possible data issues identifying other vehicle types • Bus once every 430 thousand miles: nearly three times more often • Van once every 3.28 million – nearly three times lessoften. • Collisions by road length • “Total number of collisions per 100 miles of road within the authority, where the road owner is the local authority” • What about dramatically different networks? • City of London: 54 per thousand miles • Herefordshire: 2 per thousand miles – 27 times safer??
So is it possible to compare? • Comparison is not straightforward • Distinguish network or resident issues • What are the best comparators? • Proximity? • Comparable size? • Rurality / population density? • Socio demographics? • Network characteristics?
Local comparisons with MAST • Highway Authority Network Classification • Most Similar Authority • Others may become available • Adjacency, working like Most Similar Authority • Demographic classification also possible • Could use in conjunction with HANCS • Absolute population? • Population density?
A network example • Characteristics of crashes involving senior drivers • Single or multiple vehicle incidents • Rows: Crash Number of Vehicles • Built up areas (by speed limit) • Columns: Speed Limit • Filter out handful of unknowns • Filter to establish baseline • Crash Year: last five years • Crash Involved Senior Driver: Yes • 100% stacked column chart
The need for comparison • Useful to have a national context • Regional context also useful • Easy to add geographical filter for one area • Crash Location Small Area • Driver Home • Hard to know which other areas to choose
HANCS Highway Authority Network Classification System
Signpost Series • Highway authority road risk (crashes) and local authority resident risk (casualties). • Road risk • Annual average crashes (2008-2012) / Annual average million vehicle miles (2008-2012). • Variation between authorities. • Resident casualty risk range from 43 to 143. • Crash risk index range from 33 to 613.
Signpost Series • London Boroughs - generally very high road risk. • Rural Boroughs tend to be lower risk.
How to Group? • Differences • Strategic road network • West Berkshire (5%) • Monmouthshire (7%) • City of London (0%) • GB (3%) • Rurality (Urban Roads) • West Berkshire (22%) • Monmouthshire (10%) • City of London (100%) • GB (36%)
How to group? • Network • Proportion of urban roads • Density
Methodology • Percentage of Urban Roads • Length of urban road (miles) / Length of all road (miles) • Network Density • Length of road (miles) / Area of highway authority (sq. miles)
Methodology Authorities with the Highest Network Density: Authorities with the Lowest Network Density:
Methodology • Groupings • London • Top 10 most densely networked highway authorities are in London • 15 of the top 20 are also in London • Other urban areas • Mixed Areas • Rural areas • 5 Super-Groups and 11 Sub-Groups
National comparison - Signpost series • Insight into local risk needs a national context • A consistent overall approach is necessary • The public will be confused by ‘league tables’ which do not compare like with like • RSA Signpost Series is designed to fill this gap • Rates preferable to absolute figures • Personal / network risk clearly distinguished
Signpost - Network comparison • Robust comparison of highway authority areas • Overall comparisons • HANCS grouping comparisons • Overall crash risk measured relative to traffic • Progress based on rolling baseline • Road user groups by road length • Mileage by mode not reliable at authority level • Urban road risk for pedestrians and cyclists included • Young driver involvement assessed and compared
Signpost - Community comparison • Robust comparison of personal risk • Both district and constituency geographies • Overall casualty risk relative to population • Progress based on rolling baseline • Age groups relative to same age population • Children as well as young, mid and senior adults • Risk to vulnerable road user groups assessed • Young adult driver involvement quantified
Correction Factors • Measuring community risk relies on residency • STATS19 measures residency by postcode • Postcode reporting is getting better • In last 5 years, 86% casualty postcodes collected • Reporting not consistent between forces • Full details available in MAST • National comparisons must allow for this
How does missing postcode correction work? All casualties reported on the roads of a police force area All casualties resident in an external authority area Casualties with known residency Casualties with postcodes Identified authority residents Known Assumed Unidentified authority residents Casualties without postcodes Casualties with unknown residency
Geographical units • Network comparison • Highway authorities • Strategic roads can be separated • Community comparison best with similar sizes • Local authority districts • Relevant in two tier counties • Congruent with HA areas • Constituencies • Now available as MAST elements, based on ONS definitions • Crash Location Small Area • Driver and Casualty Home • Useful as divisions within larger unitary authorities • National significance • Not always congruent with any local government boundaries
Signpost Dashboards • Working on comparative analysis for 5 years • Presented in a number of different ways • Internal reports • Area Profiles • eSpatial Maps • Signpost Series • Research Documents • Powerful, meaningful analysis to be made available to MAST members free of charge • MAST Dashboards to roll-out in 2014