Download
1 / 56
560 likes | 650 Vues
Understand the importance of accurate data collection and measurements in scientific investigations. Learn about the Metric System and the SI Units for length, mass, area, and volume, along with practical measurement techniques. Enhance your data organization skills with this comprehensive guide.

E N D
DATAMetric System (SI) Taking MeasurementsOrganization Presentation
Data • Your data are all the records you have gathered from an investigation. • The types of data collected depend on the activity. • Data may be a series of weights of volumes, a set of color changes, • or a list of scientific names. • No matter which types of data are collected, all data must be treated • carefully to ensure accurate results. • Sometimes the data seem to be wrong, but even then, • they are important and should be recorded accurately. • Remember that nature cannot be wrong, • regardless of what you discover in the laboratory. • Data that seem to be “wrong” are probably the result of the experimental error.
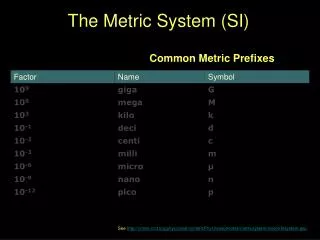
Metric System • A decimal system of measurement whose units are based on certain physical standards and scaled on multiples of ___ • Based on units of 10 ten
Metric System • Kilo (k) = 1000 • Hecta (h) = 100 • Deka (D) = 10 • Base = 1 • Deci (d) = 0.1 • Centi (c) = 0.01 • Milli (m) = 0.001 The system is easy to use because it is based on multiples of 10 1 meter = 100 cm 1 kilogram = 1000 grams 1 gram = 1000 milligrams 1 liter = 1000 milliliters 1 kilometer = 1000 meters 1 centimeter = 10 millimeters
Measurement in Science • Scientists use a revised form of the metric system called Le Systeme International d’Unites(International System of Units) or SI Units
S.I. Base Units The International System of Units (S.I.) defines seven base units for the seven base quantities:
Length • The distance from one point to another • Meter – the SI unit of length • Tool used to measure length depends on the size of the object • Larger objects (i.e. the room) • – meter stick • Smaller objects (i.e. pencil length) • – centimeter ruler Frequently used SI units 1 millimeter (mm) = 1000 micrometers (mm) 1 centimeter (cm) = 10 millimeters (mm) 1 meter (m) = 100 centimeters (cm) 1 kilometer (km) = 1000 meters (m) 1 light-year = 9,460,000,000,000 kilometers (km) Length
Measuring Length • Measure the distance from Point A to B • What distance is Point A? Point B? • What is the total distance between points? 4.5 cm 6.4 cm 6.4 cm – 4.5 cm = 1.9 cm
Mass • The amount of matter in something • Mass is measured using a balance or triple beam balance • Or an electronic balance
Mass However, some measurements of mass like the mass of vitamins or medicines are so small that we use milligrams (mg) to measure their mass • The SI unit for mass is the kilogram (kg) • The gram is the base unit Frequently used SI units 1 gram (g) = 1000 milligrams (mg) 1 kilogram (kg) = 1000 grams (g) 1 metric ton = 1000 kilograms (kg) Mass
Measuring Mass • Measured using a balance • What is the mass of this object? 175 g
Area • Area is a physical quantity expressing the size of a part of a surface. • The term can also be used in a non-mathematical context to be mean "vicinity". • Surface area is the summation of the areas of the exposed sides of an object. Frequently used SI units 1 square meter (m2) = 10,000 square centimeters (cm2) 1 square kilometer (km2) = 1,000,000 square meters (m2) Area
Measuring Area • Area = Length x Width 1 cm The square has an area of 4 square centimeters (4 cm2) 1 cm Area = l x l2 = 2 cm x 2 cm 2 cm Area = 4 square centimeters (4 cm2) 2 cm
Measuring Area • Calculate the area of the following rectangles 2 cm 3 cm cm 5 cm 8 cm Area = 2 cm X 5 cm Area = 3 cm X 8 cm Area = 10 cm2 Area = 24 cm2
Volume • The amount of space a substance takes up • Volume of a liquid is found using a graduated cylinder • Unit is liters (L) or milliliters (mL) Frequently used SI units 1 milliliter (mL) = 1 cubic centimeter (cc) or (cm3) 1 liter (L) = 1000 milliliters (mL) or 1 dm3 Volume
Measuring Volume • Liquid volume measured using graduated cylinder • Read volume at meniscus ( downward curve of water) • What is the volume of this liquid? • 45 mL
Measuring Volume • Find the volume of these liquids 15 mL 16 mL 12.5 mL
Volume • Volume of a solid is found using the volume equation • length x width x height • In this equation, we are also multiplying the units together so units for the volume of a solid are… • m x m x m = m3 OR cm x cm x cm = cm3 • Also know that 1 mL = 1 cm3 = 1 cc (cubic centimeter)
Measuring Volume • Solid volume measured using volume equation (l x w x h) What is the volume of a cube that is 2 cm x 2 cm x 2 cm? Volume = l1 x l2 x l3 = 2 cm x 2 cm x 2 cm Volume = 8 cubic centimeters (8 cm3)
Measuring Volume • Calculate the volume of the box Volume = l x w x h Volume = 6 mm X 5 mm X 2 mm 6 mm Volume = 60 mm3 2 mm 5 mm
Water Displacement • Some solid samples, such as an irregularly shaped rock cannot have their volume measured easily by using the volume equation (length x width x height) • For these solids, scientists use a technique called Water Displacement
Water Displacement • Steps of Water Displacement • 1. Add water to a graduated cylinder and record its volume (ex: 7 ml) • 2. Place the irregularly shaped solid into the graduated cylinder already containing water and record the new volume (ex: 9 ml)
Water Displacement • 3. Subtract the smaller volume(combined volume) from the larger volume (water only) to get the volume of the irregularlyshaped solid. (ex: 9 ml – 7 ml = 2 ml) • 4. We would say that the irregularly shaped solid takes up 2 ml of space. Since it is a solid, we need to state the volume using cm3 so we would say that its volume is 2 cm3
Water Displacement Volume = V2 – V1 Volume = 30– 20 Volume = 10 mL = 10 cm3
Temperature • The amount of heat in something • Tool used to measure temperature is a thermometer • Celsius is the unit of measure in the metric system
Temperature • SI unit for temperature is the Kelvin (K) • Notice that there is no degree sign used! • Kelvin scale is easier for scientists to use • To calculate Kelvin you add 273 to the Celsius temperature • Ex. 23 ○C = 23 + 273 = 296 K
-5 -5 30 -5 -10 -10 25 -10 -15 -15 20 -15 Reading a Thermometer • What’s the temperature? -5 -10 -15 -14.0 ○C -14 ○C 24.5 ○C
Time • The period between 2 events • The SI unit of time is the second (s) • Measurement tool of time is a stopwatch
Recording and Organizing Laboratory Data • There are many ways to record and organize data, including: • data tables, charts, and graphs. • It is important to include the appropriate units when you record data. • Remember that DATA are measurements or observations, not merely numbers. • Data tables, graphs, and diagrams should have descriptive titles to ensure that • another person can understand them without having been present during the • investigation. Many important scientific discoveries have been made accidentally in the course of an often unrelated laboratory activity. Scientists who keep very careful and complete records sometimes notice unexpected trends in and relationships among data long after the work is completed. The laboratory notebooks of working scientists are studded with diagrams and notes; every step of every procedure is carefully recorded.
Data Tables and Charts Data tables are probably the most common means of recording data. Although prepared data tables are often provided in lab manuals, it is important that you be able to construct your own. The best way to do this is to choose a title for your data table and them make a list of the types of data to be collected. This list will become the headings for your data columns. For example, if you collected data on plant growth that included both the length of time it took for the plant to grow and the amount of growth, you could record your data in a table (as shown below). Example Data Table Plant Growth Data These data are the basis for all your later interpretations and analyses. You can always ask new questions about the data, but you cannot get new data without re- peating the experiment.
Ways to Record Data Data Tables: • Must have a title • Must include relevant data • Must have labeled columns
Graphs • After data are collected, you must determine how to display them • One way of showing your resultsis to use a graph • Three types of graphs are commonly used • Pie (circle) graphs • Line graphs • Bar graphs
Ways to Graph Data Pie Graph: Used to show how a part relates to the whole Needed to show percentages effectively NCHS’s Biology Ice Cream Survey Vanilla 21.0% Chocolate 33.% Strawberry 12.0% Raspberry 4.0% Peach 7.0% Neopolitan 17.0% Other 6.0%
Ways to Graph Data(Continued) • Line graph: used to show change over time • Bar graph: used to compare quantitiesin different categories • Be sure to include: • Title • Axis labels • Key
Making a Line Graph Start with your data table Draw and Label Axes Experimental Data Independent Variable on the x-axis Average height liquid rose (mm) Dependent Variable on the y-axis Submersion time (sec) Would help to know that this experiment was done with paper towels
Making a Line Graph(Continued) Experimental Data Using your data table, write data pairs (10, 11) (15, 14) (20, 14) (25, 25) (30, 16) (35, 17) (40, 19)
Making a Line Graph(Continued) Use your data pairs to determine the scales for the axes 2. Write Data Pairs (10, 11) (15, 14) (20, 14) (25, 25) (30, 16) (35, 17) (40, 19)
Making a Line Graph(Continued) Start plotting your data pairs
Making a Line Graph(Continued) After plotting data, draw a line “of best fit”
Making a Line Graph(Continued) Complete the graph by summarizing its findings “As the length of time the paper towel was submerged increased, the height the liquid rose also increased.”
Making a Bar Graph Again, Start with your data table Draw and Label Axes
Making a Bar Graph(Continued) Using your data table, write data pairs
Making a Bar Graph(Continued) Use your data pairs to determine the scales for the axes
Making a Bar Graph(Continued) Start plotting your data pairs
Making a Bar Graph(Continued) After plotting data, fill in bars 36 Include a key if needed 32 28 Water absorbed (mL) 24 20 16 C B E D F A Brand of paper towel
Making a Bar Graph(Continued) 5. Summarize Trends Complete the graph by summarizing its findings 36 32 • Brands A and D were the most • effective water absorbers. • The least effective absorber • was Brand B. • Brands C, E, and F absorbed • intermediate amounts of water. 28 Water absorbed (mL) 24 20 16 C B E D F A Brand of paper towel
Graphing Review • Purposes: • Organize and analyze data • Show patterns • Communicate information • Allow scientists to make predictions • Components: • Appropriate title • Equal units on each axis with good use of spacing • Labels on each axis including units • (example, mm, sec., kg.) • Neatly created using a variety of color
Types of Graphs Graph Review