Download
1 / 49
540 likes | 837 Vues
Bioanalytical Applications of Liquid Chromatography Mass Spectrometry 液相層析質譜術於生物分析之應用. Jenn-Feng Sheen National Formosa University Department of Biotechnology. May, 10, 2010, 雲科大. Bioanalytical Applications. Drug Development

E N D
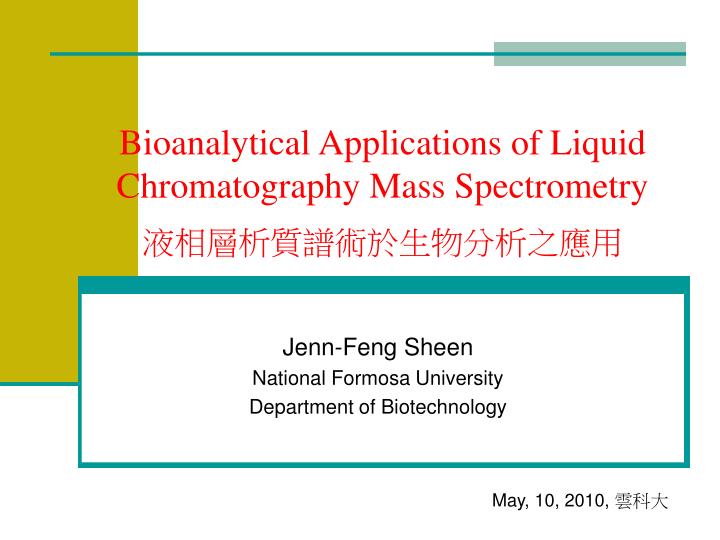
Bioanalytical Applications of Liquid Chromatography Mass Spectrometry液相層析質譜術於生物分析之應用 Jenn-Feng Sheen National Formosa University Department of Biotechnology May, 10, 2010, 雲科大
Bioanalytical Applications • Drug Development • Determination of drugs and metabolites in plasma or other biofluids. • Food Safety • Melamine dosing, Pesticides residue, myotoxins, additives. • Life Science • Proteomics, metabolomics, polysaccharides • Clinical Chemistry • Neonatal Screening, Therapeutic Drug Monitoring, Occupational Biomonitoring • Forensic Science • Drug Abuse
Liquid Chromatography Mass Spectrometry • Characterization of organic compounds (bimolecular or not) in complicate or relatively simple matrices (samples, specimens). • Qualitative and quantitative information are both obtainable. • It could be considered as a ultra sensitive and specific probe for the nature.
Brief Introduction of LC-MS/MS • A hyphened analytical system. • LC separation + MS/MS identification. • Suitable for wild range of compound-matrix combinations analysis. • Easy-to-use. • General high sensitivity. Liquid chromatography tandem mass spectrometry (LC–MS/MS), has led to major breakthroughs in the field of quantitative bioanalysis since the1990s due to its inherent specificity, sensitivity, and speed. It is now generally accepted as the preferred technique for quantitating small molecule drugs, metabolites, and other xenobiotic biomolecules in biological matrices (plasma, blood, serum, urine, and tissue).
API-MS Interface • Electrospray Ionization, ESI Preformed ion, charge residue
Heated pneumatic nebulizer LC/MS interface N2 Heat 760 torr N2 M MH+ MS H2O H2O H3O+ H2O Heat • Atmospheric Pressure Chemical Ionization, APCI gas + vaper Corona discharge needle 2-6 kV Gas phase ion-molecular reaction , IMR
Limitations of LC-MS/MS • Major in the compatibility between LC and MS. • Limited acceptable LC flow rate, ESI(< 200 uL/min), APCI(<1 ml/min). • Not allowed for nonvolatile Salts, e.g. phosphate, borate. • TFA suppresses the ES- mode. • Ion competition in ESI (matrix effect). • Limited buffer concentration, %Org/water, ion-pairing or ion-exchange agents (ESI). • Poor sensitivity for neutral compounds.
Sample Preparation • Fail sample preparation can cause: • Interference • Extraction efficiency variation • Ionization suppression/enhancement Adequate sample preparation is a key aspect of quantitative bioanalysis and can often be the bottlenecks during high-throughput analysis.
Dilute (DL) & Shoot • For samples does not contain protein (e.g. urine or bile). • Sample firstly diluted with water or initial mobile phase and then injected onto LC column. Quick, but dirty. • Poor robustness could be concerned. • Variations in column performance and ionization. • Suitable for high concentration applications which a extensive dilution can be applied.
Protein Precipitation (PPT) • Samples contains proteins (e.g. plasma or serum) are mixed with two times (or more) volume of organic solvents (e.g. methanol or acetonitrile). • Vortex and centrifuge are needed. • The supernatant is transferred for injection. • Note that analyte may be lost due to poor solubility. • Be careful to matrix effect and system stability.
Liquid-Liquid Extraction (LLE) • Applicable for samples with or without proteins. • Usually, large phase ratio between organic solvent and sample is used to ensure a good extraction efficiency. • Nitrogen Drying is often applied. • More polar solvents (e.g. ethyl acetate, chloroform) give less clean extracts. • Cost-effective but not environment-friendly.
Solid Phase Extraction (SPE) • Applicable for samples with or without proteins. • Base on serious procedures including: • condition of the sorbent cartridge, loading of the sample (preconditioned), wash with weak solution (low elution strength) and elution of the analyte with strong solution. • More clean sample solution is generally resulted. • Less matrix effect and system instability problem. • High cost and labor intensive.
On-Line SPE- direct sample (plasma) analysis without sample manipulation and preparation. R.N. Xu et al. / Journal of Pharmaceutical and Biomedical Analysis 44 (2007) 342–355
Anionic attachment-ESI Neural hydroxyl drugs Anionic Adduct Ions NH4Br NH4Cl NH4F 氟離子加成電灑法於中性氫氧基藥物之分析 • Neutrals exhibit unsatisfied response in ESI-MS. • Chemical derivatization complicate the analytical process.
Mephenesin, MW=182.22 Simvastatin, MW=418.57 Guaifenesin, MW=198.22 [M+FHF]- [M-H]- Podophyllotoxin, MW=414.41 Inositol, MW=180.16 [MF]- 氟離子加成之ESI-MS質譜 [M+FHF]- mephenesin [MF]- [M+FHF]- guaifenesin [M+FHF]- [MF]- simvastatin [MF]- [M+FHF]- [M+FHF]- 本研究所選擇中性氫氧基藥物之化學結構。 [MF]- [M+FHF]-
107 181 [M-H]- mephenesin 陰離子加成離子之氣相穩定性 123 guaifenesin [M-H]- 197 [M-H]- X- H+ 399 (proton bonded mixed dimmers of anions) 115 [M-H]- simvastatin 283 417 Cai, Y.; Cole, R. B. Anal. Chem. 2002, 74, 985-991 383 [M-H]- 413 podophyllotoxin 179 [M-H]- inositol 199 氟離子加成離子之子代離子質譜圖
氟離子加成法分析血漿中(a) mephenesin及(b) guaifenesin 之質譜層析圖。 (a) Blank plasma 201>107 m/z 0.5 ml plasma, liq-liq, post-infusion of 0.2 mM NH4F 201>107 m/z 0.05 ng/ml 201>107 m/z 5 ng/ml (b) 217>123 m/z Blank plasma 217>123 m/z 0.05 ng/ml 217>123 m/z 5 ng/ml
Hydrophilic Interaction Liquid Chromatography (HILIC) - It was introduced by Alpert (1990) and later used by Strege in tandem with MS in drug research (1998). -HILIC is similar to NPLC in that elution is promoted by the use of polar mobile phases, but is unique in that the presence of water in the mobile phase is crucial for the establishment of a stagnant enriched aqueous layer on the surface of the stationary phase into which analytes may selectively partition, as described by Alpert.
HILIC-retention of small polar compounds 1. Uracil 2. 5-fluorocytosine 3. cytosine
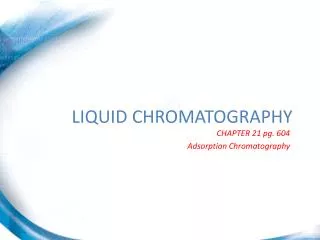
Monolithic Chromatography-Bimodal Pore Structure Onyx™ is a silica-based monolithic HPLC column. This technology creates highly porous rods of silica with a revolutionary bimodal pore structure. Macroporous Structure Allows rapid flow (up to 9mL/min) at low pressures Each macropore is on average 2 μm in diameter and together form a dense network of pores through which the mobile phase can rapidly flow at low pressure dramatically reducing separation time. Mesoporous Structure Creates large surface area The mesopores form the fine porous structure (130Å) of the column interior and create a very large surface area on which adsorption of the target compounds can occur. The unique combination of macropores and mesopores enables Onyx™ monolithic HPLC columns to provide excellent separations in a fraction of the time compared to a standard particulate column.
Turbulent Flow Chromatography • Allows direct injection of biological samples into an MS/MS system. The turbulent flow of the mobile phase quickly flushes the large sample compounds through the column to waste before they have an opportunity to diffuse into the particle pores. The large interstitial spaces between the column particles and the high linear mobile phase velocity creates turbulence within the TurboFlow column. http://www.cohesivetech.com/technologies/turboflow/index.asp
Mass Spectrometry Detection • Which ion mode is good ? • ES+, ES-, AP+ and AP- =>Base on your target structure • Basic compounds => positive mode • Acidic compounds => negative mode • Neutral compounds => poor sensitivity • High polar (ionic) => poor sensitivity • Perfect structure =>surfactant-like ESI concerns compound’s solution acidity/basicity (pKa) APCI concerns it’s gas phase proton affinity (PA)
ESI usually is more sensitive than APCI • Compounds with electronegative aromaticity and nitroaromaticity can perform radical ion formation in AP- mode. (poor stability) • MRM is always used in TSQ. • Note that the molecular ion species may be different in different mobile phase. • Remind that flow rate, water content, buffer concentration all have limits. • The most important is matrix effect problem.
大氣壓下電子捕捉化學離子化法於酸性藥物PFB-衍生物之分析大氣壓下電子捕捉化學離子化法於酸性藥物PFB-衍生物之分析 Matrix Effect: APCI < ESI Sensitivity: APCI- < ESI- Deprotonation R-COO- R-COOH [M - H ]- Negative APCI Negative ESI Electron Capture R-COO- [M – PFB]- R-COO-PFB Negative APCI
Flufenamic acid MW = 281.23 Thioctic acid MW = 206.23 Estradiol MW = 272.39 Quattri Ultima 三種具有酸性質子之西藥結構。
Thioctic acid-PFB [M-181]- (a) 未衍生藥物及其PFB-衍生物 負離子APCI質譜圖 MeOH/CAN/Water= 60/20/20, 0.5 ml/min [M-H]- (b) [M-H+32]- Thioctic acid-STD (c) Flufenamic acid-PFB [M-181]- 80%MeOH, 0.5 ml/min [M-H]- (d) Flufenamic acid-STD (e) Estradiol-PFB [M-181+32]- [M-181]- 90%MeOH, 0.3 ml/min [M-H+32]- (f) APCI parameters: Corona: 15 A, Cone Voltage: 30 V, Sourec temp: 90 oC, Desolvation temp: 600 oC, Nabulizer gas: Max, Desolvation Gas: 400 l/hr. [M-H]- STD Estradiol-STD
Thioctic Acid-PFB AP- 未衍生藥物及其PFB-衍生物在 負離子APCI下之靈敏度比較 45.2 ppb SIM (m/z 205) Thioctic Acid-STD 10-25 fold enhancement Flufenamic acid-PFB 2.65 ppb SIM (m/z 280) Flufenamic Acid-STD Estradiol-PFB 5.9 ppb, SIM (m/z 303) Mobile Phase: 80%CH3OH(aq), 1 ml/min. Corona: 20 A, Probe Temp: 600 oC Estradiol-STD
Flunitrazepam MW = 313.29 • Flunitrazepam在標準介面下之全掃瞄質譜圖 • ESI正離子全掃瞄質譜圖(4 kV, 400 oC)、 • ESI負離子全掃瞄質譜圖(-2.5 kV, 400 oC)、 • APCI正離子全掃瞄質譜圖(15 A, 500 oC)、 • APCI負離子全掃瞄質譜圖(15 µA, 500 oC)。 [MH]+ ES+ 1.23e8 (a) 分析物 Flunitrazepam (5 g/ml)溶於80%ACN(aq)、注入流速為40 µl/min。 ES- 3.86e7 (b) AP+ 1.27e8 [MH]+ (c) [M] AP- 2.57e8 (d)
Matrix Effect • Matrix effect is a phenomenon observed when the signal of analyte can be either suppressed or enhanced due to the co-eluting components that originated from the sample matrix. • When a rather long isocratic or gradient chromatographic program is used in the quantitative assay, matrix effect may be not present at the retention time for an analyte. R.N. Xu et al. / Journal of Pharmaceutical and Biomedical Analysis 44 (2007) 342–355
Matrix Effect • The difference in response between a neat solution sample andthe post-extraction spiked sample is called the absolute matrixeffect. • The difference in response between various lotsof post-extraction spiked samples is called the relative matrixeffect. Matuszewski et al. [Anal. Chem. 2003, 75, 3019]
Matrix effect can be resulted from: • Ionization reason • Endogenous compounds, e.g. lipids • Exogenous compounds, e.g. vial polymers • Anticoagulants, e.g. Li-heparin • Source design, e. g. Sciex, Waters, Thermal… • Ionization mode, e.g. ES vs AP • Extraction efficiency reason • Sample lots, e.g. differ plasma bags, volunteers
Matrix Effect Probing • For ion suppression/enhancement effect, • Compare ion signals of the analytes post-spiked at mobile phase and sample extracts solution. • Use post-column infusion method, • Let your target show off at the “matrix-free region” • Samples Lots affect both on extraction and Ionization.
(Plasma Extracts) Sample Loop (10 µL) Valco T LC Pump API-MS Syringe Pump (Standard Solution) 血漿萃出物基質效應之實驗裝置。 Matrix Effect Probing
Matrix Effect Probing (a) ES+ 314>268 4.61e5 AP+ 314>268 5.44e4 (a) (b) ES+ 286>242 1.92e5 AP+ 286>242 8.76e4 (b) • 圖5.20人類血漿萃出物對Flunitrazepam及Nifuratel • 在標準ESI介面下正離子訊號之影響。 • Flunitrazepam [MH]+、 • Nifuratel [MH]+ 。 • 圖5.21人類血漿萃出物對Flunitrazepam及Nifuratel • 在標準APCI介面下正離子訊號之影響。 • Flunitrazepam [MH]+、 • Nafuratel [MH]+ 。 血漿萃出物溶液共注入兩次(10 µl),注入時間約在 0.3-0.5 min 及 3-4 min。 血漿萃出物溶液共注入兩次(10 µl),注入時間約在 0.3-0.5 min 及 3-4 min。
非揮發性鹽類的離子抑制效應 2, 4-D in ESI- SIR m/z 221 1.11e7 ( Infusion of test compounds ) Syringe pump Waters 616 LC pump API/MS/MS SIR m/z 219 1.88e7 Valco T Rheodyne 7010 Sample injection valve ( Injection of non-volatile buffer ) 2, 4-D-PFB in ECAPCI SIR m/z 221 2.37e7 10 mM Na2HPO4 in 70% ACN(aq), 10 uL inj SIR m/z 219 3.59e7
Sample Lots Effect • Compare at least five different lots
Overcome the Matrix Effect • Normalize the biological sample, e.g. add buffer solution. • Change extraction solvent. • Let targets separated from the “matrix-affected” region. • Solid Phase Extraction (or even a complicate protocol). • Change Ion Mode, ES+/ES-/AP+/AP-. • Use the gradient elution. • Stable Isotope Internal Standard.
Determination of Unknown Leads in Mouse Plasma by LC-MS/MS Usually, quite limited sample volume is available for animal samples. By using 20 µL plasma sample, 1 ng/ml sensitivity was obtained for both compounds. Two pharmaceutical compounds were analyzed by LC-ESI-MS/MS without the structure information. IS IS Unknown 1 Unknown 1 Unknown 2 Unknown 2
Subject Analysis 76 samples R2=0.998
Determination of Specific Polypeptide in Fish and Rat Plasma by LC-ESI-MS/MS The determination of an unknown polypeptide (Mw=2334.8) in animal biological fluids was required. In ESI-MS, the polypeptide gave multiple charged ions (Fig. 1). In ESI-MS/MS, the parent ion at m/z 779 ([M+3H]3+) produced the major product ion at m/z 110 (Fig. 2). The mass transition of 779/110 was used for the SRM detection. m/z 779 = [M+3H]3+ [M+4H]4+ Fig. 1 [M+2H]2+ m/z 110 was selected for quantization. Fig. 2
By using 50 L of fish and rat plasma sample, the LLOQ was established at 62.5 ng/mL (26.7 x10⁻⁹M), good linearity was obtained in the range of 62.5-2000 ng/mL The works has been accepted by “DNA and Cell Biology”
Determination of the urinary markers of occupational exposure to toluene Toxicology Letters 147 (2004) 177–186 Benzylmercapturic acid is superior to hippuric acid and o-cresol as a urinary marker of occupational exposure to toluene O. Inoue a, E. Kannoa, K. Kasai a, H. Ukai b, S. Okamotob, M. Ikedab,∗
The analytical methods of urinary hippuric acid, creatinine, o-cresol and benzylmercaturic acid have been established in our laboratory. The urinary hippuric acid, creatinine were determined with a HPLC-UV method reported by IOSH (IOSH83-A209). The urinary o-cresol was determined with a in house developed/validated HPLC-FL method. The urinary benzylmercaturic acid was determined with a in house developed/validated HPLC-MS/MS method.
LC-UV chromatogram of hippuric acid and creatinine in Urine Hippuric acid Creatinine LC-FL chromatogram of o-cresol in Urine p-cresol o-cresol
LC-MS/MS chromatogram of BMA in Urine Both 13C6 and Methyl BMA were synthesized and had been examined as the internal standard for the determination of BMA in urine sample. It was proved, the use of isotope internal standard allowed the use of water as the blank matrix.