Download
1 / 45
450 likes | 642 Vues
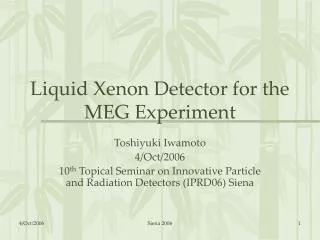
Liquid Xenon Detector Part I. CEX beam test at piE1 Oct-Dec/03 Hardware operation status Analysis A. Baldini’s presentation Other related topics Detector Calibration PMT R&D A. Baldini’s presentation Refrigerator Liquid phase purification Cryostat Liquid Xenon Detector Group.

E N D
Liquid Xenon DetectorPart I CEX beam test at piE1 Oct-Dec/03 Hardware operation status Analysis A. Baldini’s presentation Other related topics Detector Calibration PMT R&D A. Baldini’s presentation Refrigerator Liquid phase purification Cryostat Liquid Xenon Detector Group
Large Prototype • 70 liter active volume (120 liter LXe in use), 228 PMTs • Development of purification system for xenon • Total system check in a realistic operating condition: • Monitoring/controlling systems • Sensors, liquid N2 flow control, refrigerator operation, etc. • Components such as • Feedthrough,support structure for the PMTs, HV/signal connectors etc. • PMT long term operation at low temperature • Performance test using • 10, 20, 40MeV Compton g beam • 60MeV Electron beam • g from p0 decay
M/2(1cos*) * M/2 Photon spectrum 129 MeV 54.9 82.9 Elementary process M/2 - (essentially) at rest captured on protons: - p 0 n - p n 0 Eg=55 MeV * =
Eg 170o q Eg Eg p0 175o q 54.9MeV 82.9MeV 1.3MeV for q>170o 0.3MeV for q>175o Eg Angular selection • p-pp0n • p0(28MeV/c) g g • 54.9 MeV < E(g) < 82.9 MeV • Requiring q>170o • FWHM = 1.3 MeV • Requiring q > 175o • FWHM = 0.3 MeV
Overview of the beam test pumping • 25/Sep Detector was moved to the area. evacuation • 27/Sep- Beam tuning • 29/Sep pre-cooling • 2/Oct-5/Oct Liquefaction • 5/Oct-29/Oct Purification(gas phase) • 5/Oct- Electronics setup • 15/Oct p0 detected • 24/Oct empty target run • 1/Dec PMT amplifier study • 6/Dec Recovery • 7/Dec Cold xenon gas data for PMT calibration Cooling/liquefaction Beam tuning * p0 detected purification DAQ ~7weeks Recovery Cold xenon gas data
pE1 beam line • Beam line • Magic momentum (110MeV/c) • FSH52, 4mm carbon degrader (110107MeV/c) in ASY51 • 26mm carbon degrader in front of the target • S1 counter (40x40x5mm3) to define the beam • Area layout • The Electronics barrack placed in the area with concrete shielding around it. • All controls and monitors done in the barrack. • Liquid nitrogen supplied from a dewar located in the area. ASY51 Proton beam Target
Setup Lead Collimator at the beam line exit Carbon degrader
Hydrogen Target g • Thanks to Dr. J. Zmeskal. • Liquid H2 cooled with a GM-refrigerator • Temperature control • Target cell • 0.5mm t Al • 40mm d x 100 L • 125cc liquid hydrogen • Kapton foil • p entrance • g exit p g cell p
8 7 6 5 4 3 2 1 For trigger A B C D E F G H For trigger NaI detector Crystal Array • For tagging g at the opposite side of LP 8x8 NaI crystals • 40.6x6.3x6.3cm3 • Located 110cm from the target • Signal processor and Trigger Box (QUAD module) to provide trigger signal Trigger module HV Differentiator, Attenuator and base line stabilizer Output stage Differential input stage ADC Attenuator Trigger Box x10 x10 Base Line Stabilizer TDC
NaICalibration • High voltage value for each PMT is adjusted by using cosmic ray events. • Pedestal subtraction & Gain correction are done in the offline analysis. • Energy and Vertex reconstruction are performed by using corrected charge information next slides. Cosmic ray events HV adjust & Gain Correction
NaIEnergy Estimation • Search for the NaI crystal with maximum charge • Charge sum in the surrounding NaI’s. • The Calibration parameter is determined by using 129MeV g data. ( 37MeV/cosmic peak ) Reconstructed Energy • - p 0 n • 0 • (Eg = 55, 83MeV) • p- p n (Eg = 129MeV) 55MeV 83MeV Raw Sum 129MeV NaI with MaxQ threshold
NaIEnergy Resolution • 55 MeV 7.0+/-0.13 % • 83 MeV 6.5+/-0.14% • 129 MeV 6.1+/-0.04%
NaIVertex Reconstruction • Search for the NaI with maximum charge • Fit the charge distribution of the raw or column (8 NaIs in each) that include NaI with maximum charge using a gaussian function. 4cm diam. collimator. sx 2.7cm sy 1.6cm NaI with MaxQ
Timing Counter 5cm x 5cm x 1cm t BC404 R5505 • 2 layers of • 5cm x 5cm x 1cm BC404 • Hamamatsu R5505 at both ends • 3mm t Pb plate • Time resolution can be estimated internally by TC1-TC2 g S1 NaI g LP Pb g TC 100mm f Lead collimator tLP - tTC p- stopping distribution in the target must be considered in subtraction ! TC Viewed from the target
Timing Counterefficiency and resolution • ~40% efficiency for 83MeV g (> 1MeV deposit in the scinti.) • 60 psec time resolution in sigma (TC1-TC2)/2 GEANT simulation Ratio of events with > 1MeV deposit in the scintillator 129MeV 83MeV 55MeV
Xenon Large Prototypeoperating condition • Xenon extracted from the chamber is purified by passing through the getter. • Purified xenon is returned to the chamber and liquefied again. • Circulation speed 5-6cc/minute • Gain/QE calibration • LED and a as usual • PMT gain 106, 5x10⁶ • Absorption length after 2 weeks purification labs > 140cm (90% C.L.) (central value ~2.7m)
QE Calibration • Gas xenon data had been used for calibration because the absorption can be ignored in gas. • W-values are equivalent in gas and liquid? • Established purification scheme provided very pure xenon. • Possible to evaluate PMT QE’s using the a event. The peak position is well reproduced by this MC code.
Data Acquisition • Hardware setup • ADC 3 ranges for front-face PMTs 2 ranges for the others • TDC for all PMTs • PMT amplifier (x10) • BINP • Lecce • Software • Online MIDAS • Slow control (MSCB+LabView) • Refrigerator control, Temp., Pressure Monitor • Data set • Collimators in front of LP and NaI (gg back to back) • Timing Counter (Pb+Scintillator) in front of NaI Middle range Low range (x8 amplification) High range (20dB attenuation)
Trigger • back-to-back gg data • NaI : sum signal of the central 4 crystals • LP: sum signal of • 8 PMTs on the front face & 4 PMTs on the back face • gg data with opening angle < 180o • NaI : QUAD module • Very low threshold trigger for LP • One or two hit(s) in any one of 8 clusters • a, LED, cosmic-ray, pedestal triggers for calibration 5 1 6 3 2 4 g
Beam Condition target • p(p-)=107MeV/c • Almost maximum separation (8nsec) of arrival time to the target between p and m, and between p and e. • Beam intensity • Up to 2.6 MHz @ 1800mA • Electron contamination in the beam • Negligible in triggered events sx=12mm TOF separation sy=12mm ~8nsec p e/m
p0 signal example LP 55 MeV g NaI 83 MeV g NaI ADC LP 83 MeV g NaI 55 MeV g LP ADC
Background Condition • Background events • most probably caused by beam-related neutrons, • Energy deposit up to 9-10MeV, • Corresponding to 1.5x10⁶ p.e./sec • Beam on/off • PMT output for a events changes, reduced to 70% of normal values at full intensity beam rate (less reduction at lower intensity) • Not due to bleeder current shortage but due to photocathode saturation because we observed the same effect even with lower PMT gain. a events/ beam off PMTs used in LP do not have Al strip a events/ beam on • Thermal neutron in Xe • Absorption length ~ 3 cm • Capture close to calorimeter walls • Multi γ, ΣE(γ) = 9.3 MeV
Pulse Tube Refrigerator Heat load and PT cryocooler Further test and schedule
- Heat Load - -Based on the KEK-original PT cryocooler, Cryocooler with higher cooling power has been developed for the final calorimeter
Large Power Pulse Tube Cryocooler Technology transfered to Iwatani Co., Ltd Designed: 150 W @165K
Large Power Pulse Tube CryocoolerOne for Columbia University For Dark Matter Search Designed: 90 W@165K 3kWcompressor
Technology transfered to Iwatani Co., Ltd. Two for MEG Designed: 150 W @165K using 6.7kW compressor Large Power Pulse Tube Cryocooler
Large Power PT Cryocooler-Cooling power at 6.7kW compressor- For final calorimeter 6.7kW, 4Hz KEK original for Large Proto
-Achieved cooling power of 190W at 165K (6.7kW compressor) -Orientation dependence test... Horizontal layout for the case of two cold head -Another phase shift configuration (Double Inlet) test... To increase cooling power Results and Further Tests Schedule -January 2004: Final parameter fixed -February 2004: Fabrication will start -March 2004: Will be delivered (two sets) -Can be installed for the LXe liquid purification test
Liquid phase purification test • Pump and purifier in the Large Prototype chamber • Very simple • No worry about heat load
Implementation in the final detector • Xenon from the bottom bypass the wall to the pump/purifier • Easy maintenance • Possible heat load to the bottom Next slide
Realization of the system • Verification of liquid phase purification • Large Prototype is the best to show the purification performance • Long term operation in the final detector • Heat load to the bottom must be minimized
Purification systemin the final detector Gas phase purification Liquid Phase purification
Status • Fluid pump was delivered to a Japanese manufacturer. • Assembling the pump and purifier cartridge for verification. • The system will be tested using the LP. Impeller motor Pump isolator Inside of the cryostat (low temp.) Outside of the cryostat (room temp.)
Design goals: • -Design goals: • -Independent test of the inner vessel and outer vessel during construction. • -Implementation of a draining system. • -A simplification of the supporting system (three legs.) and a limiting displacement system • -Adding a pre-cooling system on the inner vessel covers. • -Adding a safety valve on the outer vessel for positive pressure. • -Adding a rohacell sheet between the outer thin window and the magnet structure for positive pressure.
Windows material -Problem with high strength austenitic stainless steel. -To obtain high yield we need a stress hardening process that causes a slight ferromagnetic characteristic that can be removed by a special heat treatment. -Size of the sheet can be another problem. -The austenitic ss with the nitrogen should have a better strength and a better magnetic characteristic.
Thickness of the Walls/Covers • Suppose the pressure tolerance of 0.3MPa for the inner vessel and 0.1MPa for the outer vessel (vacuum insulation layer).
Heat Load Calculation • See also T. Haruyama’s talk on Jul 2002 review meeting. • Main contribution is from PMT and cables. • One pulse tube refrigerator can compensate the load. • Possibility of mounting two refrigerator is now investigated
Photon Detector 2002 2003 2004 2005 Large Prototype Beam Test Beam Test Engineering runs Vessel Design Manufactoring Assembly & Test PMT Delivery + Testing Assembly Test Refrigerator Manufactoring Assembly Liq. Purification Design Manufactoring Assembly Test Milestone
Summary • CEX beam test was carried out at pE1 area. • Analysis Results A. Baldini’s presentation • Liquid Phase Purification test will be done in 2004. • Refrigerator will be assembled and delivered soon. • Cryostat design renewal. • Plan in 2004 • LP operation in pE5 to see background condition and COBRA magnetic field effect.