Download
1 / 73
730 likes | 748 Vues
Explore the optical properties of liquid xenon for PMT testing and beam experiments at PSI in Oct-Dec '03. Discuss extrapolation from gaseous phase, measurement techniques, and comparison with published data. Details on PMT test facility and cryostat schedule provided. Stay updated on the latest advancements in the field.

E N D
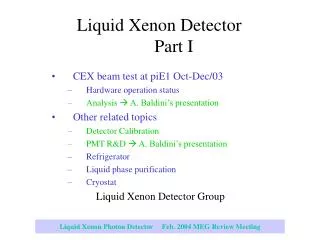
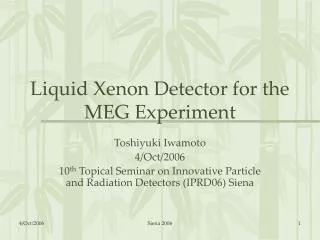
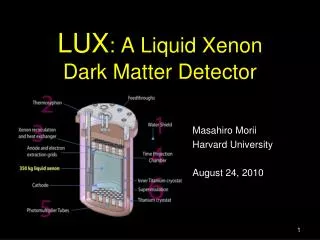
Liquid Xenon Detector and Related Topics Liquid Xenon Optical Properties (TN-020) PMT Test Facility TERAS Beam Test Preliminary Results Beam Test in Oct-Dec 03 at PSI Cryostat Schedule S.Mihara For Liquid Xenon Detector Group
LXe optical properties (MEG-TN020) • The λatt, λabsandn are not very well known properties for LXe in the VUV • Contraddictory measurements contaminations? • Controlled measurements of epsilon, nexist in gas phase: CAN WE EXTRAPOLATE FROM THE GASEOUS TO THE LIQUID PHASE? • Yes we can extrapolate give a prediction for n • Measurement of λR (LP) measurement of n
Dielectric properties vs density • In gaseous phase: Clausius-Mossotti (Lorentz-Lorenz) • LINEAR IN !! • At increasing density: non linear effects (virial expansion) 2 molecules 3 molecules …. • Molar liquid density = 0.0229 cm-3 reasonable • Xe is a non polar atom
Check linearity at different wavelengths On the absorption lines the FLL function is only marginally valid but it can be considered an acceptable approximation still at the LXe emission line...
A(ω) in VUV gas-liquid ...as it can be seen directly from the results obtained. A(ω) n = experimental data dilute gas = extrapolated value (fit)
n extrapolation • We can extrapolate a value of n=1.69 ± 0.02 at 175 nm • How this compares to published measurements? • Subtil et al. (1987) 1.71 • Chepel et al. (2002) 1.69 • Barkov et al. (1996) 1.56 (180 nm) • Pretty good agreement
A relation between n and λR • In gaseous phase: • In liquid phase: fluctuations (Einstein equation) • Hence: • A measurement of λR gives a hint on n • λR = (29 ± 2) cm*n = (1.71 ± 0.015) ! * Ishida et al, NIM A384 (1997) 380 8th power
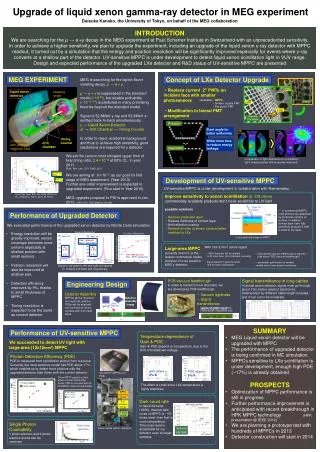
MEG – PMT cryogenic test facility: PURPOSES • - SYSTEMATIC TEST OF THE PMT’s FOR MEG IN OPERATING CONDITIONS: immersed in liquid Xe • BUILD AN EVOLUTIVE CRYOSTAT: • PHASE 1 MANUAL OPERATION WITH LXe EMPTING/FILLING FOR EACH PMT • PHASE 2 MANUAL OPERATION WITHOUT LXe EMPTING • PHASE 3 TEST OF CARTRIDGE OF PMT’s WITHOUT LXe EMPTING • - SETUP A CRYOGENIC LABORATORY AT INFN-PISA • - GET EXPERIENCE IN HANDLING LXe • - OTHER MEASUREMENTS ON LXe • - TESTS ON OTHER PMT’s AND OTHER DEVICES (APD’s, …) • FOR THE MOMENT … PHASE 1 •
Cryostat delivered from CINEL: phase I… Almost all material delivered: • Cryostat • Pumping system • Leak detector • Feed-throughs • Signal • Xenon • Gases • Oxisorb • Material for phase 2/3 Waiting for… • Xe transportation tank (needed CE certification) • Clean pipes • Slow control • PMTs!
…and phase II: linear motion and gate valves In phase II/III Xe should be kept liquid: • Gate valve The PMT can be extracted from the top of the cryostat: • Cross • Linear movement attuator
Calibration source and (+LED) 25 mm • -source that is stable in liquid Xenon: • 3 kBq 241Am deposited on a micro-etched surface • Ordered to Campoverde srl. • Quotation from a Czech factory which provides gold-plated sources. • Source and PMT holder under construction • Reference PMT: • Hamamatsu R7400-9
PMT Test Facility Status • The PMT test facilty is close to be operational • Almost all material delivered also for phase II/III • Sources in preparation • In parallel: test at warm temperature.
TERAS BEAM TEST • Overview of the test • Energy measurement • Position reconstruction • Timing measurement
TERAS beam in April 03 • Xenon liquefaction completed 10 days before the beam time. • Purification of xenon in gas phase. • Data acquisition • 40MeV(main), 20MeV, 10MeV • Different incident positions • Different incident Angles • Materials in front of the detector • PMT high gain runs
Gas return To purifier Circulation pump Gas Phase Purification System • Xenon extracted from the chamber is purified by passing through the getter. • Purified xenon is returned to the chamber and liquefied again. • Circulation speed 5-6cc/minute • Enomoto Micro Pump MX-808ST-S • 25 liter/m • Teflon, SUS
TERAS g Beam Line • Electron beam • Energy: 764MeV • Energy spread: 0.48%(sigma) • Divergence: <0.1mrad(sigma) • Beam size: 1.6mm(sigma) • Laser photon • Energy: 1.17e-6x4 eV (for 40MeV) • Energy spread: 2x10⁻⁵ (FWHM) • Divergence: unknown • Beam size: unknown • Compton Spectrum • (Eg-Ec/2)2+(Ec/2)2 Collimator size
g MC simulation Data D D Short labs Previous Test D= • D: depth parameter D: 20~100 0~25cm D Long labs This Test D D
Effect of Material • 5mmt, 10mmt, 15mmt Al • 15mmt Al+4mmt Stainless Steel • 5mmt Pb Al, Stainless, Pb plates LP 2nd collimator COBRA thickness: 0.197 X0
Incident Position 10 different positions for 40MeV g (blue and red) 2 different positions for 10MeV and 20MeV g (red) Incident Angle (40MeV) 0, 7.5, and 15 degree on the center Not analyzed yet… Position/Incident Angle Scan q LP 62mm
Detector Operation Status • No serious trouble during the test • Except one of two TDC modules was broken in the final run (PMT high gain run) • Total amount of xenon used: ~120 liter • Stable operation by the pulse-tube refrigerator/Liquid Nitrogen cooling pipe (only while circulation) • PMT calibration as usual (LED/alpha/cold gas alpha)
Energy Spectrum Fitting • Principle… • For understanding simply… • Suppose Response function is an asymmetric Gaussian Compton Spectrum Response function Eg Npe s left Convolution of Compton Spectrum Response Function s right
Energy Spectrum Fitting cont’d • Require D(depth parameter)>45 • ~34% of events in the range of 40MeV+/-4MeV are discarded by this requirement • Suppose Compton Spectrum around the edge (E-Ec/2)2+Ec2/4 • Detector Response Function • Gaussian with Exponential tail f(x) = Nexp{t/s2(t/2-(x-x0)}, x<x0+t Nexp{-1/2((x-x0)/s)2}, x>x0+t • Convolution • Integration +/- 5s • Fitting is done in two steps • Determine the edge position • Fix the edge in the 2nd fitting for determining the other prams Detection efficiency (estimated by MC) : 74% within +/- 4% energy cut at 52.8 MeV (cf. Progress Report Jul 02) (16% of events are lost due to interaction with material in front of the active volume) 26%
Dependence on Eg • Very preliminary • Typical 10, 20, 40MeV data fit using the convolution function • Error estimation is not finalized. Conservatively 30% error for the energy resolution is supposed. • Resolution is shown in sigma.
Energy Resolution vs. Depth Parameter • For g incident at the detector center • D > 35, 45, 55….85 • Resolution: < 2% in sigma except shallow events (D<45). D Number of Photoelectrons
Material Effect on the Resolution • No apparent deterioration of the resolution • Loss of efficiency Al 5mm Pb 5mm Trigger Threshold COBRA Thickness
Position Dependence 1.85% in s 1.83% in s 1.80% in s
g Measurement with half the front PMT switched off • To simulate the convex front geometry of the cryostat • MC simulation (reported in the last review meeting) • TERAS data • Switch off half of the PMTs in the front face Use 4x4 PMTs out of 6x6 PMTs • Switch off PMTs on the side walls
VLP and Curved Detector Shape studies: Compare LiXe and a VLP (100 x 50 x 50 cm3) to check the effects of adifferent geometryon position and energy resolution. • no difference with the curved detector for position resolution (10.6 mm FWHM in both cases for a realistic situation); a 3% systematic correction is needed on both coordinates for VLP • slight improvement in energy resolution (from 4% to 3.5%); • however, more critical problems of energy containment a much larger volume (1.5 m3) of Xenon would be needed (and PMTs!).
1/Npe 4 planes off 3 planes off 2 planes off 1/sqrt(Npe) 1 plane off TERAS Data Only 4x4 PMTs on the front face • Switching off half the front PMTs • Compton Edge shifts by 6.2% • Resolutions are almost same (1.84 to 1.85% in s) before and after switching off. • Switching off PMTs on the side wall(s) • 1 plane off 2.05% in s • 2 planes off 2.22% in s • 3, 4 planes off > 3% in s Number of Photoelectrons
Switching off PMTs on side walls D • Deterioration of the energy resolution when switching off PMTs is not mainly caused by loss of Npe. • PMTs on the side walls compensate 1st conversion point dependence. 1 plane off Number of Photoelectrons 3 planes off D Number of Photoelectrons
Effect of a “faulty” PMT • All PMTs on: s=1.8% • Switching off one PMT on the front wall. • the nearest PMT s=2.3% • 2nd nearest PMT s=1.9% • 3rd nearest PMT s=1.9% • 300 PMTs on the front face in the final detector • ~4/300 = 1.3% loss of acceptance F30 off s=2.3% F22 off s=1.9% F28 off s=1.9%
Position Reconstruction • Simple weighted average • Using all PMTs on the front • Very fast, but not so good resolution and “bias” exits • Localized weight method • Using only selected PMTs around the energy release points to reduce the shower fluctuation effect
Simple Average Method • Data and MC are in good agreement. • Reconstruction “bias” exists. Depth Depth Depth
Localized Weight Method • Projection to x and y directions. • Peak point and distribution spread • Position reconstruction using the selected PMT
Timing Measurement • 128 TDC channels for the PMTs around the front face. • Leading-edge discriminator with threshold level at –12mV. • Start timing of the TDCs is determined by the xenon detector itself. • Laser start timing 1ms jitter. • Electron tagging counter was placed in a TERAS Q-magnet. Difficult to achieve good resolution as a reference. • Same method as in KSR electron beam test is employed for timing measurement. • Detector is divided to left and right groups and arrival time difference was compared to evaluate the resolution.
Timing MeasurementVery Preliminary Result We observed that • Timing resolution improves as the PMT gain increases. • Timing resolution improves as Npe increases. • The best value (48.8 psec in sigma) was obtained for >160MeV synchrotron radiation light taken in a dedicated run Left Effect of shower fluctuation along the g incident direction is canceled, while the effect perpendicular to it is not. g Right
Open Questions • Compton Spectrum Shape • Broader than simulated shape • Detector effect ? • Reflection or absorption on the PMT window? • Rate Dependence
Compton Spectrum Shape • Broad peak of the total photoelectrons. • Many low energy events. Maybe beam spectrum We have not a clear answer threshold
Comparison with revised MCCompton g spectrum shape • Electron beam spread at the collision point • Collimator position MC Data
Reflection or Absorption on the PMT window? D (Qsum-Qfront)/Qsum Qsum
Discrepancy at Low Energy Side z<0 Data MC 0<z<3 total photoelectrons total photoelectrons z: first conversion depth [cm] , 0 means surface of LXe.
Rate Dependence LED • Rate dependence • In case of high current in TERAS, SR light background is huge to decrease the effective gain of the PMTs. • Data with a 60Co source in front of the entrance wall at different distance to simulate g background. • Detailed analysis to interpret the measured dependence for the actual detector operating condition is not finished yet… a