Download
1 / 86
860 likes | 1.31k Vues
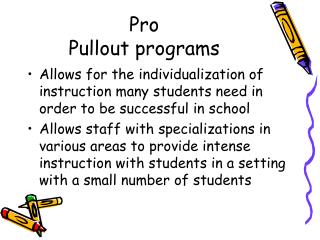
Pro Pullout programs. Allows for the individualization of instruction many students need in order to be successful in school Allows staff with specializations in various areas to provide intense instruction with students in a setting with a small number of students. Con Pullout Program.

E N D
ProPullout programs • Allows for the individualization of instruction many students need in order to be successful in school • Allows staff with specializations in various areas to provide intense instruction with students in a setting with a small number of students
ConPullout Program • Classroom teacher is held accountable for learning but many children are missing valuable instructional time because of pullout programs • Fragmentation of student’s instructional day
Disruptive to whole-class teaching • Missed instructional time • Create teacher frustration and friction between staff members • Students are believed to suffer academically
What does the research show about the value of pullout programs?
Let’s Look Back • Affleck, J., Madge, S., Adams, A., & Lowenraun, S. (1988). Integrated classroom versus resource model: academic viability and effectiveness. Exceptional Children, 54, 339-349.
Summary • University of Washington and the Issaquah, Washington School District developed a service delivery model for educating students with mild disabilities in integrated classrooms • Administered jointly by regular and special education personnel
Summary • Conducted 2 studies over the course of 3 years – Academic Achievement of Special Education Students and Academic Achievement of Regular Education Students
Definition of Integrated Classroom • Regular curriculum and materials are used • Students with disabilities (LD, MR, ED) are educated in regular classrooms • Teachers have all had successful prior experience • Aides are assigned for 1 ½ - 3 hours per day.
Method for Spec. Ed. • 3 year study • All students with LD, ED, or MR were assigned to the Integrated Classroom Model (ICM) classes • Only LD included in this study because of insufficient numbers of students with other types of disabilities
Method • Contrast group composed of special education groups in the same district who were enrolled in a resource room • Students pulled out from 30 to 150 minutes daily • Same instructional materials and methods for basic skill instruction are used in resource room as ICM classrooms
Method • Nonequivalent control group design was used • Age percentile scores of three subtests were converted to normal curve equivalent scores to allow a more appropriate statistical analysis • ANCOVA was applied using the pretest scores as the covariate for the posttest scores • Trait-treatment-interactional analysis was used to determine further effects of treatment
Sample for Spec. Ed • All students in both groups were Caucasian • Both groups had equal socioeconomic status as determined by reduced school lunch data • Teachers in ICM and resource room model had similar experience and background • Teachers from both models participated in staff development activities during the 3 years
Instruments for Spec. Ed. • Reading, math, and language subtests of Woodcock-Johnson Psycho-Educational Battery was administered in October and May of each year
Results for Spec. Ed. • No significant differences between groups during all 3 years in reading or language • One significant difference in math during Year 1, in which the adjusted mean for the integrated students was significantly higher than for resource students • Trait Treatment Analysis shows more gains than losses in each subject in each program by at least 2:1. • No significant difference in gains/losses between the two programs
Method for Reg. Ed. • Subjects were placed in ICM during Year 1 of the study and a regular classroom the following year. • Contrast group was randomly selected from each corresponding grade level at the same building
Sample for Reg. Ed. • 39 regular education students in grades 3 and 4 from one building, and grade 5 from another building.
Instrument for Reg. Ed. • California Achievement Test Battery was group-administered in the fall of Year 1 (pretest) and Year 2 (posttest) • Battery percentile scores were converted to NCE scores • ANOVA was used on pre, post, and gain scores.
Results for Reg. Ed. • No significant differences between the two groups
Discussion • Cost-benefit • Savings of $13,500 in ICM classroom compared to resource • Savings of $41,250 for regular education in a school that converts from resource model to ICM because special education funds part of teachers salaries.
Conclusion for Study 1 • Results of Study 1 support ICM as an alternative service delivery model for students with LD. • ICM is not a more favorable program, just comparable
Conclusion for Study 2 • Support ICM as an effective program for regular education students as there were no distinguishable differences in achievement between students in ICM classroom and in a classroom with students with no disabilities
Additional Limitations • Only addresses students with LD – what about when classrooms that have students with other types of disabilities • Can’t generalize to urban, rural, or culturally diverse settings (all Caucasian students in the study) • Working in a school system that was already using integrative instruction • Study conducted by University of Washington. They have been working with this school system on this model. Perhaps biased because they want to prove this model is effective in order to continue their work
Benefits • No pullout • Possibly reduces stigma • Eliminates scheduling problems • Eliminates coordination of curriculum in two settings • Support LRE • ICM is co-funded • Less space needed
A Comparison Study of the Ohio Proficiency Test Results between Fourth-Grade String Pullout Students and Those of Matched Ability • Wallick,M. Journal of Research in Music Education, Summer 1998, Vol. 46, No. 2, pp. 239-247.
Summary • Examine the effects of a pullout string program on student achievement in the writing, reading, math, and citizenship sections of the Ohio Proficiency Test
Method • Two-group static-group comparison design • A two-sample independent t-test analysis was used to determine if there was a significant difference between the achievement scores of the string students who were excused from class twice a week for 30 minutes and the matched group of nonstring students who remained in class.
Method cont. • T-test, mean, SD, and p value of each matched group were calculated and compared • .05 was the level of significance used
Sample • 148 fourth-grade string students and 148 fourth-grade nonstring students from a southwestern Ohio city school district • Ability-matched according to their performance on the verbal section of the Cognitive Abilities test
Sample cont. • Hamilton, Ohio school system serves 9,900 students from diverse cultural and socioeconomic backgrounds • 296 students in this study were drawn from 12 of the 13 elementary buildings (one building doesn’t have strings in the 4th grade)
Instruments • Cognitive Abilities Test to match students • Ohio Proficiency Test to measure student achievement
Results • Significant difference in favor of the string students’ achievement in reading and citizenship • No significant difference between the two matched groups in the writing and math sections of the Ohio Proficiency Test
SS = string students who were excused from class 30 minutes twice a week. NS = matched-ability nonstring students who remained in the classroom. OPT = Ohio Proficiency Test
Discussion • One explanation for string students’ scoring significantly higher in reading and citizenship could be that both sections require good reading comprehension and critical thinking skills • Reading music involves interpreting abstract symbols and translating them similar to reading text.
Discussion cont. • Authors suggest that string students aren’t losing instruction because they are learning new concepts like understanding fractions (1/4 note, ½ note) and manipulating rhythm
Conclusion • There were no negative effects to the pullout program
Limitations • Study was conducted by music teachers – perhaps biased • Inability to assess the impact of different classroom teachers and school atmospheres on string students’ learning (in schools where strings participation is encouraged – students may have less difficulty because of cooperating teachers)
Outcomes for students with learning disabilities in inclusive and pullout programs • Rea, P., McLaughlin, V. & Walther-Thomas, C. (2002). Exceptional Children, 68, 203-223.
Summary • Investigated the relationship between placement in inclusive and pullout special education programs and academic and behavior outcomes for students with learning disabilities (LD)
Method • Descriptive investigation which used quantitative and qualitative methods • Explored relationship between placement of students with LD and achievement, behavior, and attendance • Archival data was used • Significance was established at .05
Method • Objective data relating to number of accommodations and amount of special education services were collected from a review of students’ IEP. • Doctoral students analyzed the data and interrater reliability was established.
Sample • Students in the 8th grade in two middle schools in a suburban school district in the southeast • Students with LD who had not been enrolled in their assigned school program for at least 2 years were removed from the sample • Sample size was 58 students • Majority of students were Caucasian • 12.1 percent received free/reduced lunch
Instruments • Final course grades in language arts, math, science, and social studies • Iowa Test of Basic Skills – standard scores on reading, math, science and social studies • State Literacy Passport Test • Student attendance records
Results • The two programs differed significantly • Students in inclusive classrooms: • Earned higher grades • Achieved higher or comparable scores on standardized tests • Committed no more behavioral infractions • Attended more days of school
Results cont. • IEP’s for students in inclusive settings had 3.22 number of goals compared to 2.50 number of goals for students in pullout program • Goals inclusive settings – focused on general ed. curriculum • Goals pullout programs – focused on deficit areas and remedial skills
Results cont. • Statistically different patterns of implementation for classroom accommodations (instruction, assessment, & behavior) • Inclusion – avg. of 14.8 accommodations • Pullout – avg. of 5.6 accommodations • Time • Inclusion – avg. of 740 minutes per week • Pullout – avg. of 252 minutes per week
Results cont. • Students in inclusive classrooms earned significantly higher grades in all four areas of academic instruction • Statistical analysis of data on performance on the reading, math, and writing subtest of the state proficiency test revealed no significant differences between students who received inclusion vs. pullout services
Results cont. • Statistical analyses of data from Iowa Test of Basic Skills showed students with LD receiving inclusive services achieved higher standard scores on language and math than students receiving pullout services • Both groups had similar mean scores on reading comprehension, science, and social studies subtests
Results cont. • Statistical analyses of data indicated no significant differences between the two groups relative to behaviors that warranted in-school or out-of-school suspensions. • Attendance data showed that students in inclusive classrooms attended significantly more days of school than students in pullout programs.
Discussion • Five key findings: • 1. Students in inclusive settings received higher course grades suggesting that programs that provide a strong focus on the standard school curriculum is beneficial for students with LD