Download
1 / 24
240 likes | 385 Vues
The Effects of Weather on Freeway Traffic Flow. Alex Bigazzi. 2009 ITE Quad Conference , Vancouver, B.C. Meead Saberi K. Priya Chavan Robert L. Bertini Kristin Tufte. Visibility. Precipitation. Wind Speed. Speed. Flow. Objectives. Study Area. I-5 NB Freeway Portland, OR. MP 302.5

E N D
The Effects of Weather on Freeway Traffic Flow Alex Bigazzi 2009 ITE Quad Conference , Vancouver, B.C. Meead Saberi K. Priya Chavan Robert L. Bertini Kristin Tufte
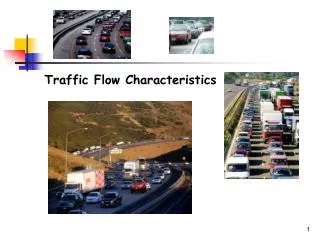
Visibility Precipitation Wind Speed Speed Flow Objectives
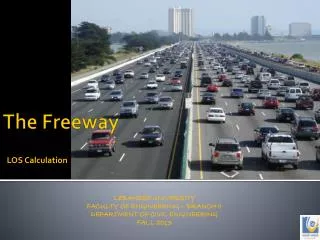
Study Area I-5 NB Freeway Portland, OR MP 302.5 MP 305.12 MP 307.9
Traffic Data Data Source: Portland Oregon Regional Transportation Archive Listing (PORTAL) Data Characteristics: Weekdays 2005, 2006 and 2007 (14,965 hours) Hourly aggregated dual-loop detector data Incident free hours
Weather Data Data Source: National Oceanic and Atmospheric Administration (NOAA) Weather Station: Portland International Airport (PDX) Hourly rainfall, visibility and wind speed
Weather Categorization Total N = 14,965 N(1) = 13,389 N(2) = 602 N(3) = 572 N(4) = 371 N(5) = 31 Rainfall Classification: 1) No rain 2) Very light rain (0-0.01 in/hr) 3) Light rain (0.02-0.04 in/hr) 4) Moderate rain (0.05-0.16 in/hr) 5) Heavy rain (>0.16 in/hr) Note: ‘No rain’ data excluded from plot
Weather Categorization Total N = 14,965 N(1) = 14,084 N(2) = 881 Visibility Classification: 1) High visibility (>5 mi) 2) Low visibility (≤5 mi) Note: measurement maximum of 10 mi (excluded from plot)
Weather Categorization Total N = 14,965 N(1) = 531 N(2) = 14,434 Wind Speed Classification: 1) High wind speed (>15 mph) 2) Low wind speed (≤15 mph)
Statistical Significance Non-Parametric Kruskal-Wallis Test
Effects of Rainfall on Mean Speed Probabilistic Approach 17:00
Statistical Significance Non-Parametric Kruskal-Wallis Test
Effects of Rainfall on Mean Flow Probabilistic Approach 17:00
Statistical Significance Non-Parametric Mann-Whitney Test
Statistical Significance Non-Parametric Mann-Whitney Test
Effects of Wind Speed • Wind speed effects on speed and flow were similar to visibility effects • High winds corresponded with low visibility
Conclusions • We observed traffic changes with rain at these locations; amount varied with intensity and hour of day • Speeds up to 7 mph lower when raining • Flows up to 230 vph lower when raining • Effects not always statistically significant – relationship with congestion is unclear • Unknown seasonal influences • Unknown sensitivity to weather categorization
Conclusions • We observed traffic changes with visibility at these locations; amount varied with hour of day • Speeds up to 5 mph lower with low visibility • Flows up to 150 vph lower with low visibility • Effects not always statistically significant • Unknown categorization sensitivity • Unknown seasonal influences • Possible correlation with rainfall effects
Conclusions • We observed traffic changes with wind speed at these locations; amount varied with intensity and hour of day • Speeds up to 6 mph lower with high winds • Flows up to 170 vph lower with high winds • Effects not always statistically significant • Unknown categorization sensitivity • Unknown seasonal influences • Possible correlation with rainfall effects
Next Steps • Work with higher resolution weather and traffic data (5-min aggregated weather data are also available) • Look at more sites • Sensitivity analysis of weather classification
Questions? Thank you!