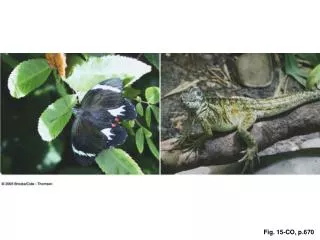
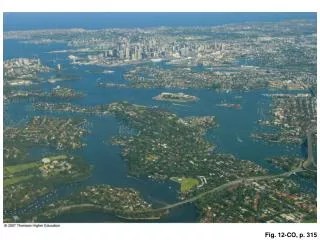
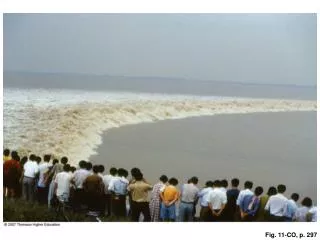
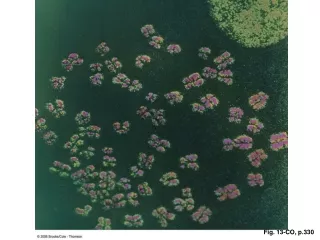
1 / 40

Fig. 16-CO, p. 447

Fig. 16-CO, p. 447. Fig. 16-1, p. 449. Fig. 16-2, p. 450. Fig. 16-3, p. 451. Fig. 16-4, p. 451. Carrying capacity. Environmental resistance. Number of individuals. S curve. J curve. Time. Fig. 16-4, p. 451. Fig. 16-5, p. 452. a. Random. b. Clumped. c. Uniform. Fig. 16-5, p. 452.
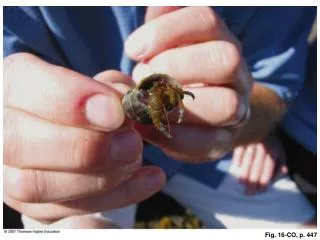
rollin
Télécharger la présentation

Fig. 16-CO, p. 447

An Image/Link below is provided (as is) to download presentation Download Policy: Content on the Website is provided to you AS IS for your information and personal use and may not be sold / licensed / shared on other websites without getting consent from its author. Content is provided to you AS IS for your information and personal use only. Download presentation by click this link. While downloading, if for some reason you are not able to download a presentation, the publisher may have deleted the file from their server. During download, if you can't get a presentation, the file might be deleted by the publisher.

E N D

Presentation Transcript


  1. Fig. 16-CO, p. 447

  2. Fig. 16-1, p. 449

  3. Fig. 16-2, p. 450

  4. Fig. 16-3, p. 451

  5. Fig. 16-4, p. 451

  6. Carrying capacity Environmental resistance Number of individuals S curve J curve Time Fig. 16-4, p. 451

  7. Fig. 16-5, p. 452

  8. a Random b Clumped c Uniform Fig. 16-5, p. 452

  9. Fig. 16-6a, p. 454

  10. Fig. 16-6b, p. 455

  11. Box 16-1, p. 456

  12. Fig. 16-7, p. 457

  13. Hundreds of hours of exposure in six months 0 5 10 15 20 25 30 35 40 Zone 2.0 6.5 I 6.0 5.5 5.0 Standard mean high water, 5.0 ft 1.5 II 4.5 4.0 3.5 Intertidal height (m) 1.0 Intertidal height (ft) 3.0 Standard mean sea level, 3.0 ft 2.5 III 2.0 0.5 1.5 1.0 0.5 0.0 0.0 Standard mean lower low water, 0.0: tidal datum IV 0.5 a b Fig. 16-7, p. 457

  14. Fig. 16-8, p. 458

  15. Fig. 16-9a, p. 458

  16. Fig. 16-9b, p. 458

  17. Fig. 16-9c, p. 458

  18. Fig. 16-10, p. 459

  19. Fig. 16-11, p. 459

  20. Fig. 16-12a, p. 460

  21. Fig. 16-12b, p. 461

  22. Fig. 16-12c, p. 461

  23. Fig. 16-13, p. 462

  24. 0 0 Depth (ft) Depth (m) 2,300 700 18.43 hr 19.35 hr Sunset 18.38 hr a 0 0 Depth (ft) Depth (m) 700 2,300 05.30 hr 06.00 hr 06.30 hr Sunrise 05.59 hr b Fig. 16-13, p. 462

  25. Fig. 16-14, p. 463

  26. Fig. 16-15, p. 463

  27. Fig. 16-16, p. 464

  28. Fig. 16-17, p. 464

  29. Fig. 16-18a, p. 465

  30. Fig. 16-18b, p. 465

  31. Fig. 16-18c, p. 465

  32. Fig. 16-19, p. 465

  33. Fig. 16-20, p. 466

  34. Bottom current Chimney Precipitation FeO(OH) MnO2 Precipitation CaSO4 FeS Sedimentation Seawater seepage H2S in water Basalt Basalt Precipitation FeS,FeS2,CuFeS2 350°C (660°F) 350°C (660°F) Magma Fig. 16-20, p. 466

  35. Bottom current Precipitation FeO(OH) MnO2 Chimney Precipitation CaSO4 FeS Sedimentation Seawater seepage H2S in water Basalt Basalt Precipitation FeS, FeS2, CuFeS2 350ºC (660ºF) 350ºC (660ºF) Stepped Art Fig. 16-20, p. 466

  36. Fig. 16-21a, p. 467

  37. Fig. 16-21b, p. 467

  38. Fig. 16-22, p. 468

  39. Fig. 16-23, p. 469

  40. Fig. 16-24, p. 470

More Related