Visual Display of Data
Visual Display of Data. Brad McMillen Evaluation and Research Department. Things to Consider. Choices: Text Tables Charts/Graphs What do you want to say? Who are you saying it to? What is the most concise way to say it?. Example.

Visual Display of Data
E N D
Presentation Transcript
Visual Display of Data Brad McMillen Evaluation and Research Department
Things to Consider Choices: • Text • Tables • Charts/Graphs What do you want to say? Who are you saying it to? What is the most concise way to say it?
Example Taken from http://www.cdc.gov/nccdphp/dnpa/obesity/trend/maps/index.htm
Text Between 1996-97 and 2006-07, the number of students enrolled in WCPSS grew by 50%. During that same time, however, the number taking AP exams increased by 175% and the number of exams taken increased 195%.
Table Simple, but effective • Can be one or two-dimensional (rows and/or columns) • Good for displaying smaller (or larger!) amounts of data • Layout of table can determine how the audience consumes the data
Bar/Column Chart Usually used to show changes over time or comparisons among groups/categories • Clustered Column - compares values across categories • Stacked Column - shows the relationship of individual items to the whole • 100% Stacked Column - compares the percentage each value contributes to a total across categories
Line Chart Shows changes or trends over time • Either for a single category or multiple • Horizontal axis usually is a time measurement • Usually with equal intervals of time
Pie Chart Shows the proportionality across categories as they relate to a whole • Pie - displays the contribution of each value to a total • Exploded Pie - displays the contribution of each value to a total while emphasizing individual values
Scatterplot Shows pairs of values plotted according to X-Y coordinates • Good for illustrating the relationship between two variables • Good for displaying the amount of “spread” in the data
Histogram • A chart (usually a simple column chart) that takes a collection of measurements and plots the number of measurements (called the frequency) that fall within each of several intervals
Principles of Good Graphics • Clearly labeled • Not too “busy” • Readable font • Quickly draws attention to the desired point • Reasonable choice of metric and precision
Example Taken from http://www.cdc.gov/nccdphp/dnpa/obesity/trend/maps/index.htm
Sources of Deception in Graphics • Labels not specific • Scaling of axes is inappropriate • Choice of chart type “leads” reader to the wrong conclusions • Ignores important contextual factors • Too much stuff – obscures the point
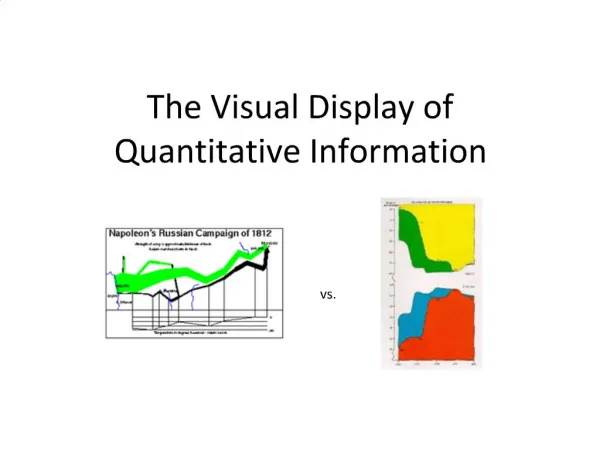
Taken from Tufte, E. (1983). The Visual Display of Quantitative Information. Cheshire, CT: Graphics Press.
Brad McMillen Evaluation and Research Department Wake County Public Schools bmcmillen@wcpss.net (919) 850-1903