Simple Aircraft Cost Functions
210 likes | 408 Vues
Simple Aircraft Cost Functions. Prof Nicole Adler University of Jerusalem Dr William Swan Boeing 2 July 2004 ATRS Symposium, Istanbul. Overview. Cost vs.. Distance is Linear Illustration Explanation Calibration Why we care Cost vs.. Airplane Size is Linear Illustration Explanation

Simple Aircraft Cost Functions
E N D
Presentation Transcript
Simple Aircraft Cost Functions Prof Nicole Adler University of Jerusalem Dr William Swan Boeing 2 July 2004 ATRS Symposium, Istanbul
Overview • Cost vs.. Distance is Linear • Illustration • Explanation • Calibration • Why we care • Cost vs.. Airplane Size is Linear • Illustration • Explanation • Calibration • Why we care • Cost vs.. Distance and Size is Planar • Why we care
Cost vs. Distance is Linear • Cost for a single airplane design • Example 737-700 • Cost based on Engineering cost functions • Data from 25-year Boeing OpCost “program” • Divides cost into engineering components • Fuel, crew, maintenance, ownership • Calibrates components from airline data • Records of fuel burn • Knowledge of crew pay and work rules • Schedule of recurring maintenance and history of failures • Market Ownership Rents allocated to trips
Engineering Approach is Different • Not a “black box” • We made what is inside the box • Not a statistical calibration • Although components are calibrated against data • Less an overall average • OpCost calibrations based on detail records • OpCost estimates costs • For standard input cost factors: fuel, labor, capital • Ongoing function recalibration • This report from 2001 version • 2004 version now in use
We Generate “Perfect” Data Points • Cost for exactly the same airplane • At different distances • Each point with identical input costs • Fuel, labor, capital • Superb spread of data points • Costs at 1000, 1500, 2000, 3000, 4000, 5000km distances • Much larger than spreads of averages for airlines • Comparable overall average distance • Much greater sensitivity to slope • Objective is to learn the shape of the relationship • Find appropriate algebraic form • For ratios of costs at different distances
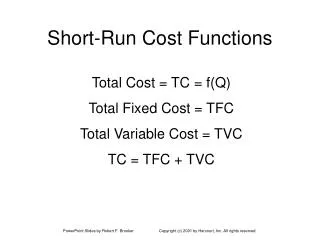
Explanation:Why is Cost Linear With Distance? • Most costs are per hour or per cycle • Time vs. distance is linear: speed is constant • (roughly ½ hour plus 500 mph) • Departure/arrival cycle time is about ½ hour • Some costs are allocated • Allocation is per hour and per cycle • Ownership, for example • Very small rise in fuel/hour for longer hours • Beyond 8 hours, crew gains 1 or 2 pilots • Does not apply to regional distances.
Observations • All airplanes’ cost vs.. distance was linear • Calibration using 6 “perfect” data points • Least squares • Slopes per seat-km similar • Intercept in equivalent km cost similar • 757s designed for longer hauls • Otherwise comparable capabilities
Why we Care • Costs Linear with distance means • Average cost is cost at average stage length • We generally know these data • We can adjust and compare airlines at standard distance • Cost of an extra stop are separable • Stop cost independent of where in total distance • Simplifies Network Costs • Costs are depend on total miles and departures
Why we Care • Costs Linear with Seats means • Average cost is cost at average size • We generally know these data • We can adjust and compare airlines at a standard size • Cost of Frequency and Capacity are Separable • Frequency cost is independent of capacity • Powerful Independence in Network Design • Costs and values of Frequencies • Cost and need for capacity
Calibration for Planar Formula • NOT Cost = a + b*Seats + c*Dist + d*Seats*Dist • Yes: Cost = k * (Seats + a) * (Dist + b) = k*a*b + k*b*seats + k*a*Dist + k*Seats*Dist NOTE: only 3 degrees of freedom
Why We Care • Planar function is VERY easy to work with • Decouples frequency, size, distance • Vastly simplifies network design issues • Allows comparison of airline costs after adjustment for size and stage length • Calibration with broad ranges of size and distance means slopes are very significant
Calibration Techniques • Calibrate each airplane vs.. distance • Two variables, k and b • Calibrate a for least error • Unbiased • Least squared • Compare to least % error (log form) • Compare to size-first process • Results very similar • Results also similar to 4-variable values
Calibration Formula Cost = $0.019 * (Seats + 104) * (Dist + 722) Where Cost means total cost 2001US $ per airplane trip, non-US cost functions. Seats means seat count in standard 2-class regional density. Dist means airport-pair great circle distance in kilometers.
Calibration Formula Cost = $0.0115 * (Seats + 211) * (Dist + 2200) Where Cost means total cost 2001US $ per airplane trip, non-US International trip cost functions. Seats means seat count in standard 2-class long haul density. Dist means airport-pair great circle distance in kilometers.