Download
1 / 42
420 likes | 658 Vues
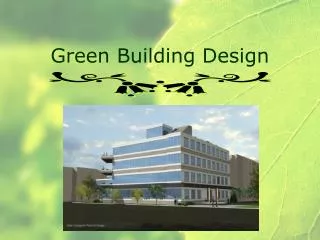
Economic Benefits of Green Building Design and Construction A primer for government decision makers . Economic Benefits of Green Building Design and Construction A primer for builders and project managers. Why “Green” Building?.

E N D
Economic Benefits of Green BuildingDesign and ConstructionA primer for government decision makers
Economic Benefits of Green BuildingDesign and ConstructionA primer for builders and project managers
Why “Green” Building? • Purpose: To enhance a building’s overall performance while improving comfort; indoor air; energy, water and materials efficiency; and the bottom line. • Buildings use or produce: • 30% of total energy use • 60% of electricity • Billions of gallons of water daily • 30% of solid waste generated
Economic Factors • First Costs/Savings = costs and savings from incorporating green features into a building Life-Cycle Costs/Savings=costs/savings over a building’s or feature’s useful life • Relative costs components of a commercial building over 30 years • Design & building = 2% • Operations, maintenance, finance & employees = 98% • Key point: more should be spent on better design
Economic Factors • First Costs of green buildings: will vary significantly depending on the specific project goals. • While there are many significant benefits that are ‘no additional cost’ (e.g, South facing windows), some features will cost more in both design and materials costs. • Estimates for additional first cost are as low as 0-3%, for LEEDTM Certified, to 10% or more for higher LEEDTM ratings. • Existing incentives aimed at offsetting additional first costs range from 3% (Federal Office of General Services and California DGS) to 6% (NY State tax credit).
Economic Factors • Life-Cycle Savings from: • Energy & Lighting Efficiency • Water Efficiency • Materials Efficiency • Employee Productivity • Employee Health • Construction & Debris Recycling
Energy Efficiency & Lighting • Energy savings up to 80% • Sources of Savings: • Lighting • Windows • HVAC Systems • Efficient lighting & better windows can lead to smaller and less costly HVAC system
Energy Efficiency & Lighting • Energy savings from efficient lighting: • Payback period can be < 2 years • Average investment return 50-80% • Energy efficient buildings • Investment return usually 20-40% • Higher property asset value
Energy Efficiency & Lighting Example: US Postal Service, Rodeo, CA • Total lighting load 71% • in both ambient and task lighting
Energy Efficiency & Lighting Example: Energy Efficient Windows Can decreaseheating costs by 40%
Energy Efficiency & Lighting Example: Energy Efficient Windows Can decrease cooling costs by 32%
Energy Efficiency & Lighting Example: Schools • Spend more than $6 billion annually on energy • DOE estimates possible 25% savings through: • Energy efficiency • Renewable energy technologies • Improved building design • Daylit schools vs. non-daylit schools: • 22%-64% energy cost reductions • Payback for new daylit schools < 3 years • Increase in student performance
Water Efficiency • Water savings from: • Water-efficient fixtures and appliances • Water-efficient landscaping • Rainwater collection systems • Benefits include: • water bills • volumes of wastewater • energy costs for hot water
Water Efficiency Example: Municipal Plumbing Incentive Programs • New York City Toilet Rebate Program • Water demand 50-80 million gallons/day • Wastewater flow 7% • $393 million investment • $605 million saved from deferral of expansion projects • Santa Monica, CA Toilet Replacement Program • 15% in average total water demand • 20% in average total wastewater flow
Water Efficiency Example: Water-Efficient Landscaping • Denver, CO • Low water landscaping cost = 1/2 standard irrigation • Almost eliminates water use in lawns • Also saves labor, fertilizer, herbicides & fuel • Palm Desert, CA Water-Efficient Median Strips • Well-received by the public • 85% in water & maintenance costs
Water Efficiency Example: Rainwater Collection System • Residence -- Austin, TX • Rainfall collected from roof • 84,000 tank can provide 100 gallons/day • Met all 2-person household needs since 1988 • Worked well during 3-year drought • Cost of system < drilling well or connecting to water district • Can fire insurance premiums
Employee Productivity • Green buildings worker productivity • Environmental factors impacting productivity • Indoor air quality • Climate control • Lighting, esp. daylighting • “Biophilic” features -- views, plants, etc.
Employee Productivity Case Study: US Post Office, Reno, NV • Energy efficient lighting and dropped ceiling • Cost = $300,000 • Energy savings $22,400/year, payback 13 years • Impact on productivity • Sorting errors dropped to 0.1% • 8% in mail sorted per hour • Annual productivity gains $400-500K • Payback period < 1 year
Employee Productivity Case Study: Herman Miller SQA Building • 295,000 s.f. office & manufacturing center • Extensive daylighting • Interior “street” with plants • Passive heating & cooling • $35,000+ annual energy savings • Impact on productivity • worker effectiveness and productivity
Employee Productivity Example: Daylighting & Student Performance • Daylighting, windows, skylights • 15-25% faster progress on math and reading tests • 7-18% higher test scores • Students in daylit facility for multiple years • 14% on standardized tests
Employee Health • US EPA ranks indoor air quality (IAQ) as one of top 5 environmental risks to public health. • Indoor contamination levels can be 25 times as high as outdoors. • Solutions: eliminate sources and increase ventilation
Employee Health Factors contributing to poor IAQ • Inadequate ventilation • Chemical contaminants from indoor sources • VOCs, smoke, other toxics • Sources: building materials, cleaning products • Chemical contaminants from outdoor sources • Vehicle & building exhausts thru vents & windows • Combustion products from garages
Employee Health Factors contributing to poor IAQ • Biological contaminants • Bacteria, molds, pollen, & viruses • Inadequate temperature, humidity & lighting
Employee Health • “Sick Building Syndrome”(SBS) • Health & comfort linked to time in building • No specific illness or cause identified • “Building Related Illness” (BRI) • Symptoms of diagnosable illness identified, (e.g., asthma, upper respiratory infections) • Directly linked to airborne building contaminants
Employee Health World Health Organization says SBS affects • 1.34 million U.S. office buildings (OSHA) • 20 million U.S. workers daily (OSHA) • 20-35% of workers in modern buildings (EPA) • Costs California about $6 billion annually (LBL)
Employee Health Healthy buildings can illness and costs • Estimated annual productivity $30 - 150 billion • 10 - 30% respiratory diseases • 20 - 50 SBS symptoms • .5 - 5% office worker performance • $17 - 43 billion annual health care savings • $12 - 125 billion direct in worker productivity
Materials Efficiency Efficient use of building materials & land Environmental benefits • Saves “embodied” energy • Saves energy & water over life of building • Use of non-virgin or recycled materials • Depletion of natural resources • Mining & manufacturingpollution
Materials Efficiency Efficient use of building materials & land Economic benefits • Initial costs • “Right-sizing” of infrastructure and mechanical systems • Optimum value engineering (OVE) • labor & materials in foundations, framing $ finishes • wood in framing 25% without performance • Life-cycle costs • costs for energy & water • Durable materials last longer, costs
Materials Efficiency Case Studies • Emeryville, CA affordable housing development • Framing at 24” instead of 16” • Significant saving on volume of wood used • 50,000 sq. ft. school • Costs of carpet vs. durable floor compared • Includes installation, maintenance & replacement costs • Over 40 years, durable flooring saves $5.4 million
C & D Debris Recycling Scope of the Problem • 136 million tons of building-related C&D debris (1996) • 43% from residential sources, 57% non-residential • Demolition = 48%, renovation = 44%, construction = 8% • 20 - 30% recovered for processing & recycling • Most often recycled: concrete, asphalt, metals, wood. • “Deconstruction” highest diversion rates (76%)
C & D Debris Recycling Environmental Benefits Reuse or recycling (vs. dumping) C & D debris: • Saves “embodied” energy in materials • Demand for virgin resources • Need for limited landfill space
C & D Debris Recycling Economic Barriers to Increased Recovery • Cost of collecting, sorting, and processing • Contamination of recovered materials • Value of recycled material vs. cost of virgin material • Low cost of C&D debris landfill disposal (tipping fees)
C & D Debris Recycling Economic Benefits of Debris Recovery • Cost often hauling and dumping as waste • Daily pick-up by recycling company • Keeps site cleaner • Work efficiency & safety • Compliance with landfill disposal reduction ordinances • Landfill disposal (tipping) fees are increasing • Revenue from sale of recovered materials
C & D Debris Recycling Case Study: New Construction - Union City, CA • Development of 95 large, single-family homes • Builder worked with recycling subcontractor • 85% of construction waste recovered and recycled • 1,000 tons of materials diverted from landfill
C & D Debris Recycling Case Study: Deconstruction - Riverdale, Maryland • Disassembly & salvage of common building materials • 2,000 square foot, 4-unit residential building • Costs competitive with demolition • Labor most significant cost • Minimized soil & vegetation disturbance
C & D Debris Recycling Case Study: Demolition, Milwaukee County Stadium • 2,000 truckloads of recyclable debris • 30,000 tons of concrete crushed on site • Crushed concrete used as infill at new stadium • $2 million budgeted for demolition • Final cost only $800,000 • Recycling of concrete saved $1.2 million
“First Cost” Incentives Cost/Benefits of Green Building • Most benefits now accrue to owners & tenants • Green practices sometimes cost of building • State and local policies can • Builder/contractor “first costs” • Help builders/contractors share in life-cycle savings
“First Cost” Incentives ESCOs (Energy Services Companies) • Respond to existing energy price signals, but don’t address integrative approaches • Construct & monitor energy-efficient systems • Performance contracting • Compensation based on results measured over building life • savings from energy consumption • Minimizes customer risk and initial capital expenditures
“First Cost” Incentives Local Green Building Incentives • Expedited (“fast track”) permit review for local building permits; environmental features may also address larger permit issues such as CEQA • Inspection fees • Subsidized training in green building practices • Free professional advice & design assistance
“First Cost” Incentives Other Local Policy Initiatives • Fees based on estimated energy use • Adjusted for size of building • Waived if on-site renewable energy system installed • Standards and regulations • Bigger the building, more green components required • Minimum recycled content (in concrete, etc.) required • Old-growth wood, high VOC materials prohibited
“First Cost” Incentives State Green Building Incentives • Tax credits for developers • Environmental performance criteria must be met • Approach minimizes state overhead costs • NY State AB 11006 • 6% for fuel cells, photovoltaics, non-ozone depleting refrigerants • Energy use must be no more than 65% of code • Portland ‘Green Building Standard’ • $20,000 per commercial project to help with green design, LEED cerfitication and energy modeling costs • $3,000 per residential home
Conclusion • Demonstrable benefits exist in many projects • Life cycle benefits must be considered to justify higher first costs • Expedited permits and tax incentives are straightforward and can be effective when well-designed