Chapter 6 Classification and Prediction (2)
Chapter 6 Classification and Prediction (2). Outline. Classification and Prediction Decision Tree Naïve Bayes Classifier Support Vector Machines (SVM) K-nearest Neighbors Accuracy and Error Measures Feature Selection Methods Ensemble Methods Applications Summary.


Chapter 6 Classification and Prediction (2)
E N D
Presentation Transcript
Outline • Classification and Prediction • Decision Tree • Naïve Bayes Classifier • Support Vector Machines (SVM) • K-nearest Neighbors • Accuracy and Error Measures • Feature Selection Methods • Ensemble Methods • Applications • Summary
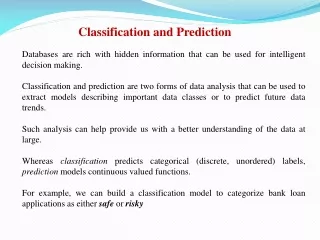
Bayesian Classification: Why? A statistical classifier: performs probabilistic prediction, i.e., predicts class membership probabilities Foundation: Based on Bayes’ Theorem. Performance: A simple Bayesian classifier, naïve Bayesian classifier, has comparable performance with decision tree and selected neural network classifiers Incremental: Each training example can incrementally increase/decrease the probability that a hypothesis is correct — prior knowledge can be combined with observed data Standard: Even when Bayesian methods are computationally intractable, they can provide a standard of optimal decision making against which other methods can be measured
Bayesian Theorem: Basics Let X be a data sample (evidence) with class label unknown Let H be a hypothesis that X belongs to class C Classification is to determine P(H|X), (posteriori probability), the probability that the hypothesis holds given the observed data sample X P(H) (prior probability), the initial probability, which is independent of X. E.g., A customer will buy computer, regardless of age, income, … P(X): probability that sample data is observed P(X|H) (likelyhood), the probability of observing the sample X, given that the hypothesis holds E.g.,Given that X will buy computer, the prob. that X is 31..40, medium income
Bayesian Theorem Given training dataX, posteriori probability of a hypothesis H, P(H|X), follows the Bayes’ theorem Informally, this can be written as posteriori = likelihood x prior/evidence Predicts X belongs to Ci iff the probability P(Ci|X) is the highest among all the P(Ck|X) for all the k classes
Towards Naïve Bayesian Classifier Let D be a training set of tuples and their associated class labels, and each tuple is represented by an n-D attribute vector X = (x1, x2, …, xn) Suppose there are m classes C1, C2, …, Cm. Classification is to derive the maximum posteriori, i.e., the maximal P(Ci|X) This can be derived from Bayes’ theorem Since P(X) is constant for all classes, only needs to be maximized
Derivation of Naïve Bayes Classifier Naïve: A simplified assumption: attributes are conditionally independent (i.e., no dependence relation between attributes): This greatly reduces the computation cost: Only counts the class distribution If Attribute Ak is categorical, P(xk|Ci) is the # of tuples in Ci having value xk for Ak divided by |Ci, D| (# of tuples of Ci in D) If Ak is continous-valued, P(xk|Ci) is usually computed based on Gaussian distribution with a mean μ and standard deviation σ: probability density function and P(xk|Ci) is
Naïve Bayesian Classifier: Training Dataset Class: C1:buys_computer = ‘yes’ C2:buys_computer = ‘no’ Data sample X = (age <=30, Income = medium, Student = yes Credit_rating = Fair)
Converted Dataset • Age * • 1 : <=30 • 2 : 31 – 40 • 3 : >40 • Income • 1 : low • 2 : medium • 3 : high • Student • 0 : no • 1 : yes • Credit_rating • 1 : fair • 2 : excellent • Buy_computer (class label) • 0 : no • 1 : yes
Train the Naïve Bayesian Classifier P(Ci) P(buys_computer = “yes”) = 9/14 = 0.643 P(buys_computer = “no”) = 5/14= 0.357 Compute P(X|Ci) for each class P(age = “<=30” | buys_computer = “yes”) = 2/9 = 0.222 P(age = “<= 30” | buys_computer = “no”) = 3/5 = 0.6 P(income = “medium” | buys_computer = “yes”) = 4/9 = 0.444 P(income = “medium” | buys_computer = “no”) = 2/5 = 0.4 P(student = “yes” | buys_computer = “yes) = 6/9 = 0.667 P(student = “yes” | buys_computer = “no”) = 1/5 = 0.2 P(credit_rating = “fair” | buys_computer = “yes”) = 6/9 = 0.667 P(credit_rating = “fair” | buys_computer = “no”) = 2/5 = 0.4
Predict The Class Label • A new record • X = (age <= 30 , income = medium, student = yes, credit_rating = fair) • Predict the probability • P(X|Ci) • P(X|buys_computer = “yes”) = 0.222 x 0.444 x 0.667 x 0.667 = 0.044 • P(X|buys_computer = “no”) = 0.6 x 0.4 x 0.2 x 0.4 = 0.019 • P(X|Ci)*P(Ci) • P(X|buys_computer = “yes”) * P(buys_computer = “yes”) = 0.028 • P(X|buys_computer = “no”) * P(buys_computer = “no”) = 0.007 • Therefore, X belongs to class (“buys_computer = yes”)
Avoiding the 0-Probability Problem Naïve Bayesian prediction requires each conditional prob. be non-zero. Otherwise, the predicted prob. will be zero Ex. Suppose a dataset with 1000 tuples, income=low (0), income= medium (990), and income = high (10), Use Laplacian correction (or Laplacian estimator) Adding 1 to each case Prob(income = low) = 1/1003 Prob(income = medium) = 991/1003 Prob(income = high) = 11/1003 The “corrected” prob. estimates are close to their “uncorrected” counterparts
Naïve Bayesian Classifier: Comments Advantages Easy to implement Good results obtained in most of the cases Disadvantages Assumption: class conditional independence, therefore loss of accuracy Practically, dependencies exist among variables E.g., hospitals: patients: Profile: age, family history, etc. Symptoms: fever, cough etc., Disease: lung cancer, diabetes, etc. Dependencies among these cannot be modeled by Naïve Bayesian Classifier How to deal with these dependencies? Bayesian Belief Networks
Outline • Classification and Prediction • Decision Tree • Naïve Bayes Classifier • Support Vector Machines (SVM) • K-nearest Neighbors • Accuracy and Error Measures • Feature Selection Methods • Ensemble Methods • Applications • Summary
SVM—Support Vector Machines A new classification method for both linear and nonlinear data It uses a nonlinear mapping to transform the original training data into a higher dimension With the new dimension, it searches for the linear optimal separating hyperplane (i.e., “decision boundary”) With an appropriate nonlinear mapping to a sufficiently high dimension, data from two classes can always be separated by a hyperplane SVM finds this hyperplane using support vectors (“essential” training tuples) and margins (defined by the support vectors)
SVM—History and Applications Vapnik and colleagues (1992)—groundwork from Vapnik & Chervonenkis’ statistical learning theory in 1960s Features: training can be slow but accuracy is high owing to their ability to model complex nonlinear decision boundaries (margin maximization) Used both for classification and prediction Applications: handwritten digit recognition, object recognition, speaker identification, benchmarking time-series prediction tests
SVM—General Philosophy Small Margin Large Margin Support Vectors
SVM—When Data Is Linearly Separable m Let data D be (X1, y1), …, (X|D|, y|D|), where Xi is the set of training tuples associated with the class labels yi There are infinite lines (hyperplanes) separating the two classes but we want to find the best one (the one that minimizes classification error on unseen data) SVM searches for the hyperplane with the largest margin, i.e., maximum marginal hyperplane (MMH)
SVM—Linearly Separable • A separating hyperplane can be written as W ● X + b = 0 where W={w1, w2, …, wn} is a weight vector and b a scalar (bias) • For 2-D it can be written as w0 + w1 x1 + w2 x2 = 0 • The hyperplane defining the sides of the margin: H1: w0 + w1 x1 + w2 x2 ≥ 1 for yi = +1, and H2: w0 + w1 x1 + w2 x2 ≤ – 1 for yi = –1 • Any training tuples that fall on hyperplanes H1 or H2 (i.e., the sides defining the margin) are support vectors • This becomes a constrained (convex) quadratic optimization problem: Quadratic objective function and linear constraints Quadratic Programming (QP) Lagrangian multipliers
Why Is SVM Effective on High Dimensional Data? • The complexity of trained classifier is characterized by the # of support vectors rather than the dimensionality of the data • The support vectors are the essential or critical training examples —they lie closest to the decision boundary (MMH) • If all other training examples are removed and the training is repeated, the same separating hyperplane would be found • The number of support vectors found can be used to compute an (upper) bound on the expected error rate of the SVM classifier, which is independent of the data dimensionality • Thus, an SVM with a small number of support vectors can have good generalization, even when the dimensionality of the data is high
SVM Related Links SVM Website http://www.kernel-machines.org/ Representative implementations LIBSVM: an efficient implementation of SVM, multi-class classifications, nu-SVM, one-class SVM, including also various interfaces with java, python, etc. SVM-light: simpler but performance is not better than LIBSVM, support only binary classification and only C language SVM-torch: another recent implementation also written in C.