Plotting Points In A Coordinate System
Plotting Points In A Coordinate System. How Do You Plot Points?. Before plotting points on a graph, you first have to understand the X and Y axis. The X and Y axis are number lines that run horizontally and vertically on the coordinate system.

Plotting Points In A Coordinate System
E N D
Presentation Transcript
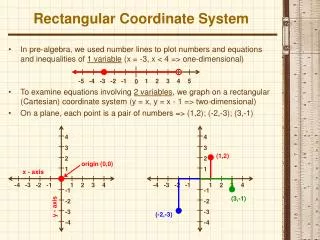
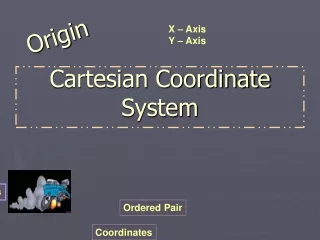
How Do You Plot Points? • Before plotting points on a graph, you first have to understand the X and Y axis. • The X and Y axis are number lines that run horizontally and vertically on the coordinate system. • An example of a set of coordinates for a point is (5,2), which is marked with the blue dot in the coordinate system on the right.
The X Axis • The X axis is the horizontal number line of the graph. • The X axis is numbered with positive coordinates on the right and negative coordinates on the left with zero in the middle.
The Y Axis • The Y axis is the vertical number line on the graph. • The Y axis is numbered with positive coordinates on the top and negative coordinates on the bottom of the X axis.
4 Quadrants • The X and Y axis together form 4 different quadrants. • The first quadrant is labeled with roman numeral I. A point in the 1st quadrant has both positive X and Y coordinates. • The second quadrant is labeled with roman numeral II. A point in the 2nd quadrant has a negative X coordinate and a positive Y coordinate. • The third quadrant is labeled with roman numeral III. A point in the 3rd quadrant has both negative X and Y coordinates. • The fourth quadrant is labeled with roman numeral IV. A point in the 4th quadrant has a positive X coordinate and a negative Y coordinates. • The green dot is the origin. The origin is where the X axis and the Y axis cross. The coordinates of the origin are (0,0) II I III IV
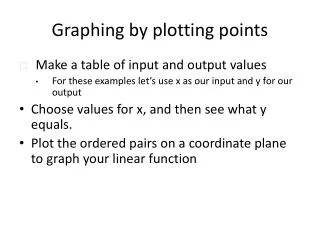
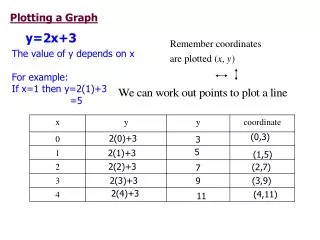
Plotting The Point • How do you find the point (2,3) within the coordinate system. • The first number (in this case 2) is the X coordinate. • The second number (in this case 3) is the Y coordinate. • This point would be 2 over on the X axis and 3 up on the Y axis. • The point (2,3) is labeled with a red dot in the coordinate system.
Maze Game • The Maze Game allows students to practice their point plotting skills by having them move a robot through a mine field to a specific point in the coordinate system. They move the robot by entering the coordinates of the point they want the robot to move next. To accomplish the mission, you must move the robot to the desired safe spot in the coordinate system (marked by a green point) without going over any mines. http://www.shodor.org/interactivate/activities/coords/index.html
Works Cited • Introduction to the Coordinate Plane and Coordinates Discussion; 4/19/04. http://www.shodor.org/interactivate/discussions/fd2.html • The x – y Plane – 1; 4/19/04. http://www.purplemath.com/modules/plane.htm