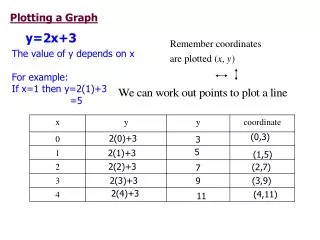
Plotting a Line
Plotting a Line. Discussion 11.5 Rev B 3/30/2006. plot(x,y,color). Example of the need for a stack. int orig_x, orig_y, endp_x, endp_y, midp_x, midp_y; if (orig_x > endp_x) then exchange orig and endp; push endp; push endp while (stack is not empty) // compute midp

Plotting a Line
E N D
Presentation Transcript
Plotting a Line Discussion 11.5 Rev B 3/30/2006
plot(x,y,color) Example of the need for a stack
int orig_x, orig_y, endp_x, endp_y, midp_x, midp_y; if(orig_x > endp_x) then exchange orig and endp; push endp; push endp while(stack is not empty) // compute midp midp_x = (orig_x + endp_x)/2; if(endp_y < orig_y) then midp_y = (orig_y + endp_y)/2 (rounded); else midp_y = (orig_y + endp_y)/2; if(midp = orig) then plot orig; pop orig; pop endp; else push endp; push midp; endp = midp; end while;
int orig_x, orig_y, endp_x, endp_y, midp_x, midp_y; if(orig_x > endp_x) then exchange orig and endp; push endp; push endp while(stack is not empty) // compute midp midp_x = (orig_x + endp_x)/2; if(endp_y < orig_y) then midp_y = (orig_y + endp_y)/2 (rounded); else midp_y = (orig_y + endp_y)/2; if(midp = orig) then plot orig; pop orig; pop endp; else push endp; push midp; endp = midp; end while; Datapath
>: if orig_x > orig_y then xgtflg <= ‘1’ ; else xgtflg <= ‘0’ ; end if; =: if (orig_x = midp_x) and (orig_y = midp_y) then eqflg <= ‘1’ ; else eqflg <= ‘0’ ; end if;
+/2: tempx <= (orig_x + endp_x); xmid <= ‘0’ & tempx(10 downto 1); +/2C: tempy <= (orig_y + endp_y); if(yltflg = '1') then ymid <= (‘0’ & tempy(10 downto 1)) + (“0000000000” & tempy(0)); else ymid <= ‘0’ & tempy(10 downto 1);
int orig_x, orig_y, endp_x, endp_y, midp_x, midp_y; if(orig_x > endp_x) then exchange orig and endp; push endp; push endp while(stack is not empty) // compute midp midp_x = (orig_x + endp_x)/2; if(endp_y < orig_y) then midp_y = (orig_y + endp_y)/2 (rounded); else midp_y = (orig_y + endp_y)/2; if(midp = orig) then plot orig; pop orig; pop endp; else push endp; push midp; endp = midp; end while;