Download
1 / 25
250 likes | 413 Vues
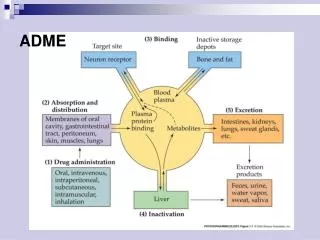
Rapid Estimates of ADME. Daniel T. Chang a , Michael-Rock Goldsmith a , Thomas R. Transue c , Rogelio Tornero-Velez a , Shane D. Peterson b , Yu-Mei Tan and Curtis C. Dary b a National Exposure Research Laboratory, US Environmental Protection Agency, Research Triangle Park, NC 27711, USA

E N D
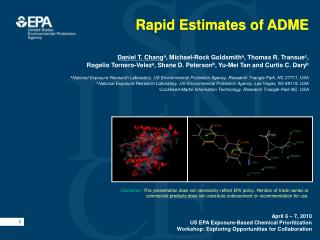
Rapid Estimates of ADME Daniel T. Changa, Michael-Rock Goldsmitha, Thomas R. Transuec, Rogelio Tornero-Veleza, Shane D. Petersonb, Yu-Mei Tan and Curtis C. Daryb aNational Exposure Research Laboratory, US Environmental Protection Agency, Research Triangle Park, NC 27711, USA bNational Exposure Research Laboratory, US Environmental Protection Agency, Las Vegas, NV 89119, USA cLockheed-Martin Information Technology, Research Triangle Park NC, USA Disclaimer:This presentation does not necessarily reflect EPA policy. Mention of trade names or commercial products does not constitute endorsement or recommendation for use. April 6 – 7, 2010 US EPA Exposure-Based Chemical Prioritization Workshop: Exploring Opportunities for Collaboration
Outline • Background • Model needs • Estimation methods • PReParE • A case study: ADME Scoping the PBPK Chemical Landscape • Summary
Generalized In Silico Profiling Workflow Computational Molecular Modeling for Evaluating the Toxicity of Environmental Chemicals: Prioritizing Bioassay Requirements James R. Rabinowitz, Michael-Rock Goldsmith, Stephen B. Little, and Melissa A. Pasquinelli Environ Health Perspect. 2008 May; 116(5): 573–577. Published online 2008 February 1. doi: 10.1289/ehp.11077. 6
Chemical Input, Simple to Complex SAR Middle: screen capture of PROPHET (Probabilistically Plausible Heuristic Enrichment of Targets) a knowledge base of > 7500 chemical/biomolecular target affinity values was mined for statistical data for 6 key descriptors (LogP, TPSA: topological polar surface area, rotatble bond count, number of H-bond donors and acceptors and molecular weight). The more likely a chemical is to be attributed to a target for which multiple of the discrete descriptors fall within the statistically sampled distribution for a given target. All filters derived from culling the KiBank dataset. Upper: screen capture of main input screen. For chemical specific parameters to be calculated the option to select (cyan) MOE-WEB to draw an individual structure and obtain relevant descriptors to be used subsequently in all RED input areas. A list of some simple QSAR established from the literature can be found here by mousing over the data predicted or the description of the individual QSAR. This will be continuously augmented with additional QSAR, such as those arising from QikProp (Schrodinger Inc.)
Mechanistic Tissue:Plasma Calculator rat and human (Poulin & Thiel, 2002)
human, mouse, rat and dog:total weight, % total weight of tissue, % cardiac output of tissue Physiological Parameter Calculators tissue-specific mRNA expression profiles for HUMAN Phase I and II metabolism enzymes and nuclear receptors
PAVA rendering of oral route ethanol (fasting) PBPK model output 1: Levitt DG. PKQuest: measurement of intestinal absorption and first pass metabolism - application to human ethanol pharmacokinetics. BMC Clin Pharmacol. 2002 Aug 15;2:4. PubMed PMID: 12182761; PubMed Central PMCID: PMC122094. NOTE: Multi-compartment PBPK schema above for illustrative purposes only Graphic from: http://commons.wikimedia.org/wiki/File:7-cpt_PBPK_model.png “Symbolic representation of a 7-compartment PBPK model” – Frederic Y Bois PAVA: Physiological and Anatomical Visual Analytics Rendering of anatomically-relevant data onto human organs (PK, gene expression, epidemiology etc…)
Case Study: ADME Scoping the PBPK Chemical Landscape (NHANES, ToxCastTM and USDA-PDP)
Can we draw molecular-derived relationships among a disparate set of chemicals? • Can we compare among different classes and/or databases? • What are the key molecular features that describe each set?
Simple ADME Space Scoping • Generalized observed trends in evaluated ADME related properties: • PBPK chemicals (on average) are smaller in molecular weight (almost half) than the 3 compared databases • TOXCASTTM chemicals tend to be larger in molecular weight • Evaluated properties are consistent with the simple MW analysis.
pc2 pc3/pc4 pc1,pc2,pc4 pc1,pc2,pc3 “pbpk space” Nhanes biomarkers USDA-PDP ToxCast 320 Chemical Space Analysis (PCA) using ChemGPS-NP “The first four dimensions of the ChemGPS-NP map, accounting for 77% of data variance…Any compound with a known chemical structure can be positioned onto this map using interpolation interms of PCA score prediction. From the resulting projections properties of the compounds can be compared and easily interpreted together with trends and clusters” – ChemGPS-NP, Larsson, 2009 pc1 – Principal component 1 (pc1): size, shape and polarizability –Principal component 2 (pc2): aromatic and conjugation related properties –Principal component 3 (pc3): lipophilicity, polarity, and H-bond capacity –Principal component 4 (pc4): molecular flexibility and rigidity
PBPK space Nhanes biomarkers USDA-PDP ToxCast 320 Obach PBPK Model “Inspired” Hyper-Surface 5 4 3 2 1 0 -1 -2 fecal ~70% overlap between USDA-PDP and ToxCastTM 320 ~40% overlap between NHANES and ToxCastTM 320 breath Log Ko/w -10 -5 -4 -3 -2 -1 1 2 3 urinary Log Ka/w
logMW x 10 Fu Thalf (hr) LogP(o/w) NRs cyp450 Metabolic Trends From the Obach 670 Dataset Obach RS, Lombardo F, Waters NJ. Trend analysis of a database of intravenous pharmacokinetic parameters in humans for 670 drug compounds. Drug Metab Dispos. 2008 Jul;36(7):1385-405. Epub 2008 Apr 21
Summary • Exposure is highly dependent on chemistry and biology and understanding ADME is key to elucidating the links (cusps) between exposure and internal doses that lead to health outcomes. • Use of pharmacokinetic models requires detailed information on ADME. In the absence of such information, we need to evaluate parameters rapidly either as surrogates or initial starting parameters (e.g., Bayesian). • ADME and chemical space scoping is highly dependent on knowledge mining capabilities, but simplifies analysis of large datasets (i.e., gives us the big picture on hundreds to thousands of chemicals) • Allows us to group chemicals based on molecular space: • Leads to better understanding of the chemicals within large datasets: Where do we need to concentrate our efforts? Where are the data gaps?, What should we be concerned with?, etc. • Rapid assessment dependent on available chemical structures (Caution must be used for chiral compounds and mixtures esp. with respect to metabolism)
Real-time in vivo pharmacokinetics?Whole-Body Autoradiography Yaghoubi, S.S. et al. Human pharmacokinetic and dosimetry studies of [18F]FHBG: a reporter probe for imaging herpes simplex virus type-1 thymidine kinase reporter gene expression. J. Nucl. Med. 42, 1225–1234 (2001).
Beer and burgers Where does all that alcohol go?
Comparative Pharmacokinetics: Fatty Diet – Fasting Diet Differential kinetics as a function of food intake