Download
1 / 14
140 likes | 311 Vues
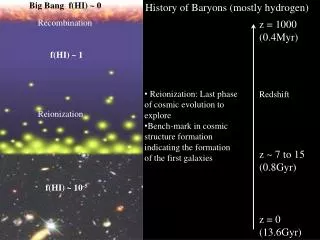
History of Baryons (mostly hydrogen). Big Bang f(HI ) ~ 0. Recombination. z = 1000 (0.4Myr). f(HI ) ~ 1. Reionization : Last phase of cosmic evolution to explore Bench-mark in cosmic structure formation indicating the formation of the first galaxies. Redshift. Reionization.

E N D
History of Baryons (mostly hydrogen) Big Bang f(HI) ~ 0 Recombination z = 1000 (0.4Myr) f(HI) ~ 1 • Reionization: Last phase of cosmic evolution to explore • Bench-mark in cosmic structure formation indicating the formation of the first galaxies Redshift Reionization z ~ 7 to 15 (0.8Gyr) f(HI) ~ 10-5 z = 0 (13.6Gyr)
‘Inverse’ views of evolution of large scale structure during reionization • Neutral intergalactic medium via HI 21cm line observations = consequence • Galaxies which drive reionization = sources z~ = 7.3 20mK Lidz et al. 2009 130 cMpc ~ 1o
Inverse Views of the Universe: Neutral IGM vs. galaxies • Power • Complete view of physics: sources of reionization and their impact on the IGM • Cross correlation of HI 21cm signal with galaxy distribution mitigates large (but independent) systematic errors (eg. foregrounds) in each measurement • Challenge: Problematic to match very (very) large scale of HI measurements with classical galaxy surveys • HI 21cm experiments cover 100 to 1000 deg2 and z range ~ 6 to 10 • Galaxy surveys by eg. JWST/ALMA have FoV ~ arcmin, dz < 0.5 • Solution: Intensity mapping of the aggregate CO emission from the galaxies that reionize the Universe
Intensity mapping: image summed signal from aggregates of thousands of galaxies on Mpc scales (tens of arcmin). No need to detect each galaxy individually.
CO intensity mapping: predicted mean brightness temperature in 3 simple steps (Carilli 2011) • 1. Cosmic star formation rate density required to reionize the IGM using mean baryon density (Haardt & Madau, Bunker et al.) • fescuv = ionizing photon escape fraction ~ 0.06 (MW), up to 0.2 for z~3 LBGs • C = IGM clumping factor (recombinations) = 5 to 30 (simulations) • Strong increase with z due to increase in mean cosmic baryon density • 2. Conversion of star formation rate to IR luminosity based on known properties of galaxies (eg. Kennicutt 1998 and many others)
Predicted Mean CO Brightness Temperature 3. Conversion of IR luminosity to CO luminosity based on known properties of galaxies (Daddi et al. 2010) • Roughly linear relationship between L’CO and LFIR for disk galaxies at low and high z • Similar slope for merger driven starbursts, with different normalization • Disks likely dominate cosmic star formation rate density
Doing some cosmic algebra => mean brightness temperature of CO emission from the galaxies that reionize the neutral IGM at a given redshift [Not what we expect to see at all redshifts, but what is required to have reionization occur at that redshift.] <TB>z=8 = 1.1 (0.1/fesc)-1 (C/5) uK (1+z)3
Major uncertainties: • fesc – calibrated with JWST observations of 1st galaxies • C – get handle via HI 21m observations (21cm forest absorption?) • Line confusion (30GHz = CO 2-1 z=6.7 or 1-0 at z=2.8): requires dual frequency, cross correlation experiment (eg. 15 and 30GHz). Cross correlation with 21cm will also help (Gong, Visbal) • Early production of CO and dust (SFR – FIR – L’CO relationships)
Early production of dust + CO: detections of 8 quasar host galaxies at z~6 M(dust) ~ 108Mo, M(H2) ~ 1010 Mo z=6.42 0.15” TB ~ 25K CO3-2 VLA PdBI -150 km/s 7kpc 1” ~ 5.5kpc + +150 km/s SFR – FIR – L’CO relationships can be calibrated with ALMA/EVLA/JWST observations of representative z>6 galaxy samples.
Gong et al.: numerical prediction of TB • Obreschkow & Rawlings CO galaxy catalog based on Millenium simulations • <TB>z=7 = 0.1 and 0.7uK • Fluctuations on 10’ scales are factor few smaller • CO auto-power spectrum can be detected at 40σ • CO-HI cross power spectrum: errors dominated by HI measurements! HI-CO cross CO auto 7’
COIM: Experimental specs (to match HI 21cm) • Observing frequencies: 10 to 45 GHz, BW > 1GHz • 0.1 to 1 uK sensitivity • Angular resolution ~ 1’ to 10’ • spectral resolution ~ 100MHz ~ 1500 km/s • FoV > 25 deg2 (LOFAR) • Gong experimental parameters: • 1000 elements of 0.7m diameter (area = 385m2; element FoV = 2o) • BW = 1 GHz, channel = 30MHz • Interferometer spacings from 0.7m to 25m (resolution ~ 3’) • 20K system at 15 GHz • 3000hrs (mosaic?)
LFIR vs L’(CO): Star Formation Law • Further circumstantial evidence for star formation • Star formation efficiency (FIR/L’CO) increases with SFR => Gas consumption time (Mgas/SFR) decreases with SFR FIR ~ 1010 Lo/yr => tc > 108yr FIR ~ 1013 Lo/yr => tc < 107yr SFR 1e3 Mo/yr Index=1.5 MW 1e11 Mo Mgas