Download
1 / 32
320 likes | 436 Vues
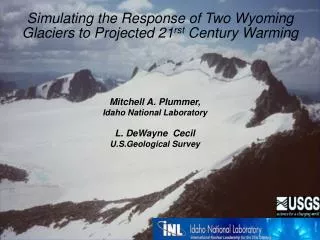
Simulating the Response of Two Wyoming Glaciers to Projected 21 rst Century Warming. Mitchell A. Plummer, Idaho National Laboratory L. DeWayne Cecil U.S.Geological Survey. Teton Range. Wind River Range. Net annual ice balance, b n. b n = net ice budget at any location in the x,y plane

E N D
Simulating the Response of Two Wyoming Glaciers to Projected 21rst Century Warming Mitchell A. Plummer, Idaho National Laboratory L. DeWayne Cecil U.S.Geological Survey
Teton Range Wind River Range
Net annual ice balance, bn • bn = net ice budget at any location in the x,y plane • Snow = total snowfall • Fraction of precipitation falling as snow • M = mass of snow melted • Calculated from energy balance when T > 0 • E = evaporation & sublimation • Calculated via turbulent heat transfer equations
Mapped Glaciers and Perennial Snow Modeled Glaciers and Perennial Snow
Photo by Ed Williams, BYU Idaho Cascade Canyon Grand Teton Mount Saint John Jenny Lake
Base case +0.5 °C +1.0 °C
Titcomb basin Upper Fremont Glacier Lower Fremont Glacier Knifepoint Glacier
August 1990 firn line, 3980 m Naftz et al. 2002
200 180 160 140 Total ice volume (m3) 120 Max ice thickness (m) 100 80 60 40 3. Five 0.25ºC temperature increases applied 2. Modern glacier just right (+0.25ºC) { 1. Modern glacier too large Glacier allowed to return to steady state
Conclusions • Modeling experiments suggest that a temperature increase of ~1.5°C would effectively eliminate the Teton and Lower Fremont glaciers • Apparent sensitivity of Fremont glacier appears inconsistent with the USGS 18O temperature record but lapse rate variations not yet explored • At late 20th century global warming rates (~0.1°C / decade), it could take as long as 150 – 200 years to dramatically increase the biodiversity of these locations • Global climate models scaled to the Pacific NW project an increase in average temperature on the order of 0.2°-0.6°C (0.3°-1°F) per decade throughout the 21st century, so maybe we can get to that species richness in 50 – 100 yrs. • Response times matter. Two retreating glaciers of different size may well be responding to completely different phenomena. • Uncertainties? Yes, but …
Questions • Barring ‘local’ redistribution of snow by wind, avalanching etc, how variable is precipitation across short distances in the mountains and how would one capture that in a simple model? • In paleoglacier modeling, • How is a large change in mountain precipitation distributed vertically? • How reasonable is it to assume constant lapse rates? • Are pseudo-vertical lapse rates related to vertical precipitation gradients? • Need more data to describe mountain climate and its variability
Terminus Photo by Ed Williams, BYU Idaho