Exploring Relationships Between Two Variables on a Graph
250 likes | 383 Vues
In this lesson, we will define and graph points on a coordinate plane, illustrating the relationship between two variables. You will learn how to plot ordered pairs, label axes, and draw a scale. We’ll explore how graphs can tell different stories, such as tracking distance over time. Additionally, we’ll analyze examples to discuss positive, negative, and zero changes in relationships. This is an engaging way to visualize data and understand the significance of coordinates in real-world contexts.

Exploring Relationships Between Two Variables on a Graph
E N D
Presentation Transcript
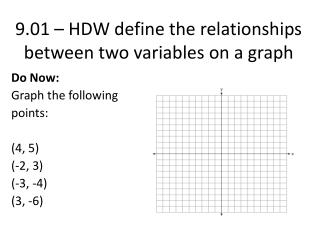
9.01 – HDW define the relationships between two variables on a graph Do Now: Graph the following points: (4, 5) (-2, 3) (-3, -4) (3, -6)
Exam Missed Who still needs to take it
Goals of today • Graph points • Coordinate plane • How do graphs tell a story
Drawing the C.P. Use a Ruler Label Axis Set scale Label Points
Points in the coordinate plane are indicated with ordered pairs (x,y) Think: (↔, ↕) Examples: (4, 5) (-2, 3) (-3, -4) (3, -6) (0, 0)
The coordinate plane Points in the coordinate plane are indicated with ordered pairs (x,y) (4,5) (-2,3) Examples: (4, 5) (-2, 3) (-3, -4) (3, -6) (-3, -4) (3, -6)
The Four Quadrants y II I (+,+) (-,+) x IV III (-,-) (+,-)
Graphing Stories • Stairs One • Stairs two • Running • Distance from Home Will probably just do two of them
Now let’s just talk not write • Tell the story of each graph
Now Tell the Story Scan here
Summary • Positive Change(“increasing”) • Negative change (“decreasing”) • Zero Change • Undefined Change
8. Homework – Bonus Practice Where is the Earth’s x-axis? Where is the Earth’s y-axis? Where is our school’s coordinate? Challenge Where is the Earth’s x-axis? Where is the Earth’s y-axis? Where is our school’s coordinate?