Download
1 / 1
10 likes | 151 Vues
Segment. Order. A. B. C. D. E. F. G. H. I. J. K. L. M. N. O. 12. 9. 10. 3. 13. 1. 4. 6. 7. 15. 14. 5. 11. 2. 8. Usable. Unusable. River Segments with Randomized Order. Reach 1. Reach 2. Suitability. A. B. C. D. E. F. G. H. I. J. K. L. M. N. O.

E N D
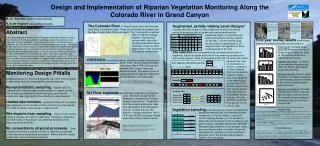
Segment Order A B C D E F G H I J K L M N O 12 9 10 3 13 1 4 6 7 15 14 5 11 2 8 Usable Unusable River Segments with Randomized Order Reach 1 Reach 2 Suitability A B C D E F G H I J K L M N O Sampling Plan Repeat Panel D N Year 1: D G L N Rotate Panel 1 G L Year 2: D C H N Rotate Panel 2 C H Year 3: A M N D Rotate Panel 3 A M 60 kcfs 45 kcfs 35 kcfs 25 kcfs 15 kcfs Design and Implementation of Riparian Vegetation Monitoring Along the Colorado River in Grand Canyon M.J.C. Kearsley Northern Arizona University N. Scott Urquhart Colorado State University The Colorado Riverin Grand Canyon flows 360 km from Lees Ferry to Diamond Creek. Flows are controlled by releases from the Glen Canyon Dam 25 km upstream. The 11 geomorphic reaches1 Augmented, serially rotating panel designs4increase the total number of sites visited over an entire monitoring period by assigning plots to repeat and rotating panels without Left: ~30% of random transect points fell on cliffs or in area where safety or other issues made it impossible to sample Transect locations and stage elevation points are defined by top and elevation control points (left) and cross-river sight points (right). Abstract In designing vegetation monitoring plans for large and complex riparian systems, three elements are critical: probabilistic sampling, regional representation, and integration with the hydrograph. Here we present a model monitoring program created for the Colorado River corridor of Grand Canyon National Park. The overall design is based on a previously constructed 2-dimensional flow model which divides the 385 km between Glen Canyon Dam and Diamond Creek into 703 segments defined by flow-controlling constrictions in the river channel. Within each segment, the flow model predicts river elevations for stages up to 1550 cubic meters per second (cms). Five elevations were sampled in each of 60 segments in 2001. This first year of data shows varying impacts of stage elevation on plot wetland indicator status, total plant abundance, richness and diversity. Measurements taken at the time of vegetation sampling indicated that the stage-elevation estimates were within 60 cms of their predicted values. differ in bedrock geology, gradient, channel and canyon width, and other physical parameters which have been shown to affect productivity in their terrestrial and aquatic communities. exceeding logistic or fiscal limits and while minimizing monitoring impacts on the sites. In the first three years we will sample a repeat panel of 20 segments plus 120 segments in three rotating panels of 40 each. First year survey results show strong effects of a moisture gradient and disturbance. Total Cover* is lowest at low and high elevations, the result of disturbance from river flows at 15k and low moisture in higher elevation plots Site selection was accomplished by randomizing the order of segments, subject to spatial restrictions5 then selecting random points within each segment. Sites at unvegetated cliffs did not need to be visited CRFSSGUI is a windows-based simulation model2, derived from because they have no information on trends in vegetation in Grand Canyon. The first (by random order) 20 usable plots were assigned to the repeat panel, and the next 120 to the first, second and third rotating panels. Thus site selection is probability based, includes 140 sites, and limits trampling from annual visits to only 20 sites. Species Richness * is highest at intermediate elevations but does not decline significantly above the 25k plots earlier work3, which predicts elevation from stage data at 704 cross-sections between Glen Canyon Dam and Diamond Creek. This allows points at which plant cover data are collected to be tied directly to the hydrograph. Monitoring Design Pitfalls Sampling designs for monitoring programs can suffer from a number of flaws which limit the interpretability of trends detected: Non-probabilistic sampling.“Typical” and / or “representative” sites are often selected based on expert opinion. This violates assumptions of random sampling, and restricts conclusions regarding trends to the collection of sites sampled. Limited site numbers. Logistic and financial constraints place limitations on the number of sites visited during a time period. This limits the power of the design to detect trends. Site impacts from sampling. Even non-destructive sampling requires site visits to collect data. Trampling, compaction, and other forms of disturbance can affect the dynamics of the resources being monitored. No connection to physical processes.Often, biological monitoring is carried out with no reference to important community structuring physical processes. Without this link, causal relationships cannot be directly identified. Wetland Indicator score is higher (facultative / facultative wetland) in low elevation plots and lowest in 65 k plots (obligate upland / upland species) Screen shot of the CRFSSGUI model output for the RM 2.6 cross-section during the June 2002 trip. Species composition shifts with plot elevation: Plots at 15k and 25k are distinct from all others, 35k and 60k plots are different from each other, but not from those at 45k. 703 River segments are defined by adjacent cross-section pairs. Elevation change in each segment is controlled by the down-stream cross-section. Predictions from the model are accurate: data from topographic and hydrographic surveys showed that 32 of 35 elevation change predictions over a 1130 cms (45,000 cfs) stage change were within 40cm of actual values. * Cover and richness graphs include “0” data from cliff cross-sections. Vegetation sampling at random points consists of locating the Literature Cited 1. Schmidt,JC; Graf,JB 1990. Aggradation and degradation of alluvial sand deposits, 1965-1986, Colorado River, Grand Canyon National Park. U.S.G.S Professional Paper No. 1493. 2. Korman,J; Walters,C 1998. Users guide to the Grand Canyon Ecosystem Model. G.C.M.R.C. anonymous FTP site. http://ftp.gcmrc.gov/model/. 49 pages. 3. Randle,TJ; Pemberton,EL 1987. Results and analysis of STARS modeling efforts of the Colorado River in Grand Canyon. Final Report. U.S.D.O.I, Glen Canyon Environmental Studies, Flagstaff, AZ. NTIS report no. PB88-183421. 4. Urquhart,NS; Paulsen,SG; Larsen,DP 1998. Monitoring for policy-relevant regional trends over time. Ecological Applications. 8, 246-257. 5. Stevens, Jr., DL 1997. Variable Density Grid-Based Sampling Designs for Continuous Spatial Populations Environmetrics. 8, 167-195. Acknowledgements We wish to thankthe veg crews, guides and volunteers who helped with the field work in conditions (which ranged from snowstorms to 43o C) including J. Banzhof, J. Behan, G. Brian, B. Burger, T. Gushue, D. Harris, M. Howe, K. Huisinga, S. Jones, A. Minard, M. Murov, M. Polino, M. Porter, B. Ralston, S. Rhodes, G. Stanfield, Thad, and the Woolbright boys (of the Siloam Springs Woolbrights). Grand Canyon Monitoring and Research Center employees C. Fritzinger, T. Gushue, S. Meitz, B. Ralston, and S. Wyse helped make the contractual, technical, and logistical nightmares go away. permanent transect line, then elevations which correspond to five river stages, using local control. Sighting frames (1 x 1m) are laid on either side of the transect and the presence and percent cover of all plant species are recorded. Because stage elevation on the transect, rather than coordinate position, is used to locate the sample points, vegetation change detected in the lower end of the transect can be directly linked to the hydrograph Above: Thalweg profile and elevation predictions from CRFSSGUI model for 5 river cross-sections Below: Cross-sections marked on aerial photographs of Cathedral Wash area at river mile 2.6