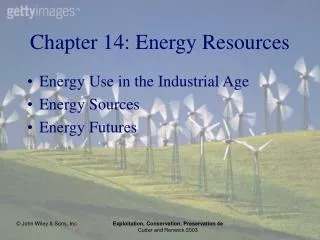
Chapter 14: Energy Resources
Chapter 14: Energy Resources. Energy Use in the Industrial Age Energy Sources Energy Futures. Energy Use in the Industrial Age. Wood, Coal, and the Industrial Revolution Oil and the Internal Combustion Engine Energy Use in the Late Twentieth Century. Shifts in U.S. Energy Use.

Chapter 14: Energy Resources
E N D
Presentation Transcript
Chapter 14: Energy Resources • Energy Use in the Industrial Age • Energy Sources • Energy Futures Exploitation, Conservation, Preservation 4e Cutter and Renwick 2003
Energy Use in the Industrial Age • Wood, Coal, and the Industrial Revolution • Oil and the Internal Combustion Engine • Energy Use in the Late Twentieth Century Exploitation, Conservation, Preservation 4e Cutter and Renwick 2003
Shifts in U.S. Energy Use Figure 14.1 U.S. energy production by source, 1870 to 1995, showing increased diversity in the sources of energy used. Exploitation, Conservation, Preservation 4e Cutter and Renwick 2003
World Energy Production Figure 14.2: World energy production showed substantial growth between 1970 and 2000, but with important periods of contraction associated with political tensions or economic decline. Exploitation, Conservation, Preservation 4e Cutter and Renwick 2003
World Oil Prices Figure 14.3: Between 1970 and 2000, prices have increased generally and also sharply as a result of the 1973 and 1979 energy crises and the 1990 Gulf War. Exploitation, Conservation, Preservation 4e Cutter and Renwick 2003
Energy Uses Figure 14.4: U.S. Energy consumption by kind of use, 1949 to 2000. Exploitation, Conservation, Preservation 4e Cutter and Renwick 2003
Energy Sources • Oil and Natural Gas • Coal • Other Fossil Fuels • Nuclear Power • Renewable Energy • Energy Efficiency and Energy Conservation Exploitation, Conservation, Preservation 4e Cutter and Renwick 2003
Known Recoverable CoalWorld Total: 1,083,000 million metric tons See Table 14.2 in the text for the rest of the top-ten list. Exploitation, Conservation, Preservation 4e Cutter and Renwick 2003
Known Recoverable OilWorld Total: 1,028 billion barrels See Table 14.2 in the text for the rest of the top-ten list. Exploitation, Conservation, Preservation 4e Cutter and Renwick 2003
Known Recoverable Natural GasWorld Total: 5,289 trillion cubic feet See Table 14.2 in the text for the rest of the top-ten list. Exploitation, Conservation, Preservation 4e Cutter and Renwick 2003
Oil and Natural Gas • Production and Consumption • Oil Futures Exploitation, Conservation, Preservation 4e Cutter and Renwick 2003
U.S. Oil Imports Figure 14.5: From 1950 to 2000, the U.S. continued to produce a significant amount of oil, but imports became an increasing proportion of U.S. consumption. Exploitation, Conservation, Preservation 4e Cutter and Renwick 2003
Gasoline Prices Figure 14.6: Despite occasional price spikes, gasoline prices, when adjusted for inflation, remain low. Exploitation, Conservation, Preservation 4e Cutter and Renwick 2003
Oil Recoverability Figure 14.7: Idealized pattern of cumulative production, based on a sigmoidal curve for oil recovery. Exploitation, Conservation, Preservation 4e Cutter and Renwick 2003
Coal • Production and Consumption • Extraction and Environmental Impacts • Underground mining • Strip or surface mining • Acid mine drainage • Surface Mining Reclamation and Control Act of 1977 Exploitation, Conservation, Preservation 4e Cutter and Renwick 2003
Coal ReservesRatio of Reserves to Production Ratio for entire world is 225 years.For details on production and reserves, see Table 14.3 in text. Exploitation, Conservation, Preservation 4e Cutter and Renwick 2003
U.S. Coal Resources Figure 14.8: Each kind of coal – with its particular sulfur content – exhibits a distinct geographic distribution. Exploitation, Conservation, Preservation 4e Cutter and Renwick 2003
Other Fossil Fuels • Coal gasification or liquefaction • Tar Sands • Shale oil Exploitation, Conservation, Preservation 4e Cutter and Renwick 2003
Nuclear Power Figure 14.10: The nuclear fuel cycle Exploitation, Conservation, Preservation 4e Cutter and Renwick 2003
Renewable Energy • Renewable and perpetual • Centralized and decentralized • Hydroelectric power • Geothermal • Solar (active and passive) • Wind Exploitation, Conservation, Preservation 4e Cutter and Renwick 2003
Efficiency and Conservation Figure 14.16: Per capita GNP and energy consumption, 1999. Countries above the trend line are less efficient than those below it. (Note log axes.) Exploitation, Conservation, Preservation 4e Cutter and Renwick 2003
Hydroelectric Generation Figure 14.12: Generation by region, 1980 to 2000. Some regions are increasing steadily, with Latin America having the greatest per-capita use. Exploitation, Conservation, Preservation 4e Cutter and Renwick 2003
Hydroelectric Potential Figure 14.13: Hydroelectric generation as a proportion of potential. Hydroelectric potential is a function both of total stream discharge and of total vertical potential. Exploitation, Conservation, Preservation 4e Cutter and Renwick 2003
Energy Futures • High-Energy Options • Fossil Fuels • Nuclear and renewable • Low-Energy Options • Conservation-Intensive • Low-growth • Energy Policies for the Future Exploitation, Conservation, Preservation 4e Cutter and Renwick 2003
ISSUES • 14.1: The Legacy of Chernobyl • 14.2: The Three Gorges Dam • 14.3: Electric Energy Deregulation and the California Energy Crisis Exploitation, Conservation, Preservation 4e Cutter and Renwick 2003
Chapter 15: The Transition to a Global Sustainable Society • Limits to Growth? • What is Sustainable Development? • How Does Sustainability Work? • Tipping the Balance • Looking Forward • Epilogue Exploitation, Conservation, Preservation 4e Cutter and Renwick 2003
Limits to Growth? Figure 15.1: Results of the 1972 model, based on two different assumptions: (a) simple extrapolation into the future; and (b) stability in population and resource use. Exploitation, Conservation, Preservation 4e Cutter and Renwick 2003
What is Sustainable Development? • Environmental Versus Economic Sustainability • A Working Definition of Sustainability Exploitation, Conservation, Preservation 4e Cutter and Renwick 2003
How Does Sustainability Work? • Waste Recycling • Waste Reduction • Design for Reuse and Recycling • Changing Consumption Patterns Exploitation, Conservation, Preservation 4e Cutter and Renwick 2003
Decoupling Figure 15.2: This simple graphic represents a daunting challenge: throughout history, resource use has always increased with wealth. Is it possible to continue increasing wealth, without a direct connection to resource use? Exploitation, Conservation, Preservation 4e Cutter and Renwick 2003
The Costs of Progress Figure 15.3: As with many pollutants, SO2 concentrations are greatest in countries experiencing the early stages of economic growth. Exploitation, Conservation, Preservation 4e Cutter and Renwick 2003
Tipping the Balance • Individual Action • Corporate Action • Government Action • Looking Forward Exploitation, Conservation, Preservation 4e Cutter and Renwick 2003