Download
1 / 49
540 likes | 896 Vues
Application of X-Ray CT for Investigation of CO 2 and WAG Injection in Fractured Reservoirs. D. Chakravarthy, V. Muralidharan, E. Putra and D.S. Schechter Texas A&M University. CO 2 for EOR. Water flooding - secondary recovery. CO 2 Flooding – Both for secondary and tertiary recovery.

E N D
Application of X-Ray CT for Investigation of CO2 and WAG Injection in Fractured Reservoirs D. Chakravarthy, V. Muralidharan, E. Putra and D.S. Schechter Texas A&M University
CO2 for EOR Water flooding - secondary recovery CO2 Flooding – Both for secondary and tertiary recovery Understanding CO2 flow is complex Extreme heterogeneities like fractures
Martin Co Borden Co Midland Co Glasscock Co Upton Co Reagan Co Spraberry Trend Area Fractured Reservoir An NFR with extensive fractures OOIP 10B bbls Ultimate recovery < 12%
Martin Co Borden Co Midland Co Glasscock Co Upton Co Reagan Co CO2 Flood in Spraberry ET O’Daniel CO2 Pilot CO2 flood not successful in mobilizing oil Fluid flow through fractures Early breakthrough, Oil bypass
Understand physical mechanisms of oil bypass Improve prediction of sweep in NFR Improve modeling of tracer studies Significance Fracture Studies Better understand multiphase flow in fractures Better performance prediction and improved recovery!
Extreme heterogeneities Common heterogeneities Injection rates Fluid mobility Fluid flow in reservoirs Fluid Flow
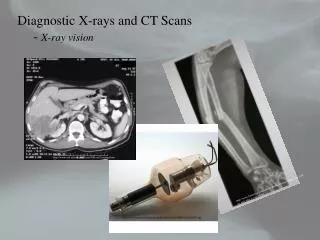
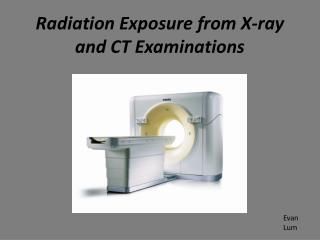
X-Ray CT Scanner Objectives • How is a highly mobile fluid like CO2 affected by heterogeneity? • What happens in the presence of fractures? • How does injection rate affect oil recovery and sweep? • Can WAG improve sweep efficiency in a fractured system? What other solutions exist?
Workstation 3D CT image X-Ray source Digital detector Object Principles of X-Ray Tomography
X-ray CT scanner • CT number • Depends on density • Based on X-Ray attenuation • Every material has a characteristic CT number • E.g. CT for air = -1000
CO2Phase diagram Experimental Outline • Displaced Fluid - SoltrolTM Refined Oil • Doping agent – 1-iodohecadecane • Displacing Fluid - CO2 • Pressure - 800 psig • Temperature - 75° F • CO2 phase – Vapor
CO2 Phase diagram 1070 psi Critical Point Solid Liquid Pressure (Not to scale) Triple Point Temperature (Not to scale) 100 psi Vapor 89°F -70°F
CO2 Phase diagram Dense Vapor Solid Liquid Pressure (Not to scale) Liquefies Does not liquefy Temperature (Not to scale) Vapor
Immiscible displacement CO2 Phase diagram Solid Liquid Pressure (Not to scale) Temperature (Not to scale) Vapor
Unfractured Cores Fractured Cores Viscosified water Injection Rates Gel Experiments CO2 injection
Low density High density Unfractured Core (a) Dry core scans Red color indicating regions with higher CT numbers (b) Oil saturated core
Injection Rate = 1 cc/min 3 minutes of CO2 injection 5 minutes of CO2 injection 15 minutes of CO2 injection 60 minutes of CO2 injection
Uniform sweep Injection Rate = 0.3 cc/min 30 minutes of CO2 injection 60 minutes of CO2 injection 120 minutes of CO2 injection 165 minutes of CO2 injection
Reconstructions (1 cc/min) Heterogeneity Oil saturated core CO2 injection – 3 minutes CO2 injection – 5 minutes CO2 injection –15 minutes CO2 injection – 45 minutes CO2 injection – 60 minutes
Uniform sweep Reconstructions (0.3 cc/min) Heterogeneity Oil saturated core CO2 injection – 30 minutes CO2 injection – 60 minutes CO2 injection – 120 minutes CO2 injection – 150 minutes CO2 injection – 180 minutes CO2 injection – 300 minutes
Decrease in CT number CT Number Plots 100% Oil CO2
CO2 Saturation CO2 Saturation – 3 Minutes CO2 Saturation – 5 Minutes CO2 Saturation – 15 Minutes CO2 Saturation – 45 Minutes
Porosity and Saturation Porosity equation Saturation equation
Producer Injector Average saturation is 95% Early breakthrough Spatial variation of saturation
Average saturation is 96.7% Late Breakthrough Spatial variation of saturation
≈ 300 minutes ≈ 60 minutes Oil recovery
Fractured Core • Fluid flows through fracture simultaneously displacing oil from the matrix • Counter current exchange mechanism Oil + gas Fracture Matrix Gas
Fracture filled with oil Fractured Core Oil saturated core
Irregular CO2 saturation due to heterogeneity Increase in CO2 saturation in fracture Breakthrough Scans
Final CO2 saturation • 2.1 PV of injection • Final recovery of about 58%
Water Alternating Gas (WAG) Alternate injection of water and gas Fairly homogeneous reservoirs In the presence of extreme heterogeneities?
Brine preparation Objective: Delay CO2 breakthrough! • Brine iodated with sodium iodide and potassium iodide • High mobility, early breakthrough • Add Xanthan to increase viscosity and reduce mobility • High injectivity • Viscosity insensitive to salinity
Higher density regions Oil saturated core Oil Saturated Core
CO2 injection (0.4 pv) Large amount of CO2 is diverted into the matrix!
Analysis • Overall recovery ≈ 85% • Incremental recovery ≈ 4.5% Reason? • Core used was strongly water wet • Xanthan still in gelant form • Considerable amount of water “leakoff” into the matrix • Increase in viscosity gave similar results
Gel Experiment with gel • Injected directly into fracture • Seen as a yellow streak in the fracture
CO2 in matrix CO2 injection
CO2 Injection Block in grooves
Final recovery • Final Recovery obtained ≈ 95% • Gel effective in diverting CO2 into matrix
Highest Recovery Oil recovery
Reliable upscaling Better Model Match saturation and flow profile apart from other parameters
Conclusions Are low injection rates better? • Lower rates give better sweep and lesser utilization of CO2 but time taken is higher. • Rates need to be optimized
Conclusions Can WAG delay CO2 breakthrough from fractures? • Viscosified water can delay breakthrough but “leak off” prevention is required (particulate matter) • Performance might be better in oil-wet reservoirs • “Washout” problems
Conclusions Is gel treatment an effective solution? • Gels can prevent breakthrough and improve recovery • No “wash out” problems
Gel placement Injection Pressure Resistance factor and “screen out” Issues Gels for conformance control Gel type
High fracture k Fluid flow through fractures Early breakthrough, oil bypass Problems Low Matrix k Fractured System
Alternate injection of specific pore volumes of water and gas to reduce gas mobility. • Proven to be mostly effective in fairly homogeneous reservoirs. • Performance in the presence of extreme heterogeneities like fractures has not been adequately investigated.