Download
1 / 59
590 likes | 766 Vues
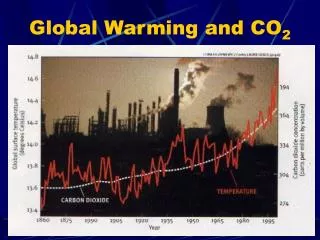
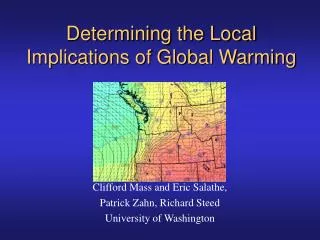
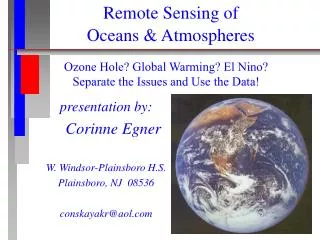
Remote Sensing of Oceans & Atmospheres. Ozone Hole? Global Warming? El Nino? Separate the Issues and Use the Data!. presentation by: Corinne Egner W. Windsor-Plainsboro H.S. Plainsboro, NJ 08536 conskayakr@aol.com. funded by see at NASA/Goddard. presented in cooperation with:.

E N D
Remote Sensing of Oceans & Atmospheres Ozone Hole? Global Warming? El Nino? Separate the Issues and Use the Data! presentation by: Corinne Egner W. Windsor-Plainsboro H.S. Plainsboro, NJ 08536 conskayakr@aol.com
presented in cooperation with: http://see.gsfc.nasa.gov/edu/SEES/ a valuable source of information, images and data available on the web
Introduction • What is Remote Sensing? • Problems and Promise of remote sensing in the classroom • The Electromagnetic Spectrum • Atmospheric Processes(Ozone) • Ocean Processes
What is Remote Sensing? • Remote Sensing Is: • Inferring something about the nature and properties of an object, surface, area, or phenomenon • through the analysis of data/information • collected by a sensor • that is not in physical contact with the object, surface, area, or phenomenon under investigation.
Why?? -- The Reasons to Teach RS • To assure the next generation has the tools to use current technology to study Earth’s environment. • Scientific literacy of the general public.
The PROMISE of Using Satellite Data in the Classroom • Spans Scientific Disciplines • Biology, Chemistry, Geology, Physics • Well-Suited for Inquiry-Based Learning • Global or Regional Perspectives • Long Historical Record (since late 1970’s) • Recent and Real-Time Data
The REALITY of Using Satellite Data in the Classroom • Technical Complexity of Data • Large Data Volumes • Computer Hardware/Software Required • Theoretical Background Needed • Lack of Curriculum
The Final Analysis? • Definitely do it! . . . . . but • Go slowly! • Try not to undertake too much at once! • Collaborate and ask for help! • Realize it’s a longterm learning process!
The Electromagnetic Spectrum thanks to Microworld’s web site: www.lbl.gov/MicroWorlds/ALSTool/EMSpec/EMSpec2.html
C A B General Sources of Radiation A- reflected radiation from surface B- incident radiation (skylight) C- radiance from the atmosphere
Topics in Atmospheric/Oceanic Module • Ocean Circulation • Sea Surface Temperature • Sea Surface Topography and Sea Height Variability • Ocean Productivity • Phytoplankton Pigment Concentration • Sea Ice Processes • Sea Ice Concentration
Sea Surface Temperature • Measurements of Terrestrial Thermal Radiation U.S. East Coast May 21, 1999
Sea Surface Temperature • Measurements of Terrestrial Thermal Radiation U.S. East Coast May 19-21, 1999
Sea Surface Temperature • Measurements of Terrestrial Thermal Radiation U.S. East Coast
Sea Surface Temperature • Measurements of Terrestrial Thermal Radiation U.S. West Coast
Polar Sea Ice Concentration • Measurements of Terrestrial Microwave Radiation March 1996 September 1996
Polar Sea Ice Concentration • Measurements of Terrestrial Microwave Radiation September 1996 March 1996
Sources of Radiation Arriving at Satellite from the Ocean Surface • Visible - Sunlight Reflected at the Surface • Visible - Sunlight Scattered Upward by Subsurface Plants & Particles • Infrared - Emitted (Terrestrial) Thermal Energy • Microwave • “Passive” Sensors Measure Emitted (Terrestrial) Microwave Energy • “Active” Sensors Illuminate Terrain with Their Own Signal, then Measure Returned Energy
Phytoplankton Concentration • Measurements of Sunlight Scattered by Subsurface Plants Global Biosphere Spring (March-May) 1998
Phytoplankton Concentration • Measurements of Sunlight Scattered by Subsurface Plants Global Biosphere Summer (June-August) 1998
Surface Roughness • Measurements of Transmitted/Reflected Microwave Radiation “Sea Empress” Oil Spill, Wales, United Kingdom, February 22, 1996
Surface Roughness • Measurements of Transmitted/Reflected Microwave Radiation Typhoon Violet, September 20, 1996
Surface Roughness • Measurements of Transmitted/Reflected Microwave Radiation Wind Speed &Wave Height
El Nino Sea Surface Temperature Anomaly December 8, 1997
El Nino TOPEX/Poseidon Sea Surface Height Anomaly December 10, 1997
La Nina Sea Surface Temperature Anomaly February 27, 1999
La Nina TOPEX/Poseidon Sea Surface Height Anomaly February 27, 1999
see Image then added: • Ability to import some satellite data formats • Macros: • Multipaste/replace of geographic overlays • To calculate & find geog coordinates • To view/analyze data in projections • (Goode, Polar, Hammer) • Facilitates annotation and key • Perform temporal Z-plot analysis etc. • Compute statistics ignoring “no-data” pixels
Ability to import satellite data AVHRR and NDVI TOMS Stratospheric Ozone ISLSCP and UV data also, but no materials exist
Geographic overlays NDVI measurement of “greenness” from the NOAA series satellite from October of 1988. Monthly averaged TOMS Ozone data from October, 1992
MultiPaste/Replace • Use a macro to apply an overlay to a stack. • No paste control window is needed. • Often relevant in geographic data with time series.