Chapter 3: Accelerated Motion
PHYSICS Principles and Problems. Chapter 3: Accelerated Motion. Accelerated Motion. CHAPTER 3. BIG IDEA. Acceleration is the rate of change in an object’s velocity. . Table Of Contents. CHAPTER 3. Section 3.1 Acceleration Section 3.2 Motion with Constant Acceleration

Chapter 3: Accelerated Motion
E N D
Presentation Transcript
PHYSICS Principles and Problems Chapter 3: Accelerated Motion
Accelerated Motion CHAPTER3 BIG IDEA Acceleration is the rate of change in an object’s velocity.
Table Of Contents CHAPTER3 Section 3.1 Acceleration Section 3.2 Motion with ConstantAcceleration Section 3.3 Free Fall Click a hyperlink to view the corresponding slides. Exit
Acceleration SECTION3.1 MAIN IDEA You can use motion diagrams to show how an object’s position changes over time. • What is acceleration? • How is acceleration different from velocity? • What information can you learn from velocity-time graphs? Essential Questions
New Vocabulary Acceleration Velocity-time graph Average acceleration Instantaneous acceleration Acceleration SECTION3.1 • Review Vocabulary • Vector a quantity that has magnitude and direction.
An object in uniform motion moves along a straight line with an unchanging velocity. Few objects move in uniform motion all the time. Acceleration SECTION3.1 Nonuniform Motion Diagrams
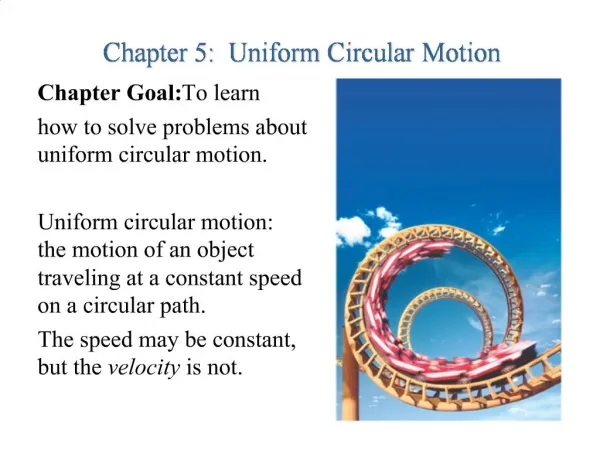
Object’s, more commonly, move in nonuniform motion, in which velocity is changing. Nonuniform motion can be in a straight line: speeding up, applying brakes, falling objects. Nonuniform motion can be along a circular path: hammer throw. Nonuniform motion can be the motion of thrown objects: baseball, football. Acceleration SECTION3.1 Nonuniform Motion Diagrams (cont.)
Acceleration SECTION3.1 Nonuniform Motion Diagrams (cont.) • You can feel a difference between uniform and nonuniform motion. • When you move in a nonuniform motion, you feel pushed or pulled. • In contrast, when you are in uniform motion and your eyes are closed, you feel as though you are not moving at all.
Acceleration SECTION3.1 Nonuniform Motion Diagrams (cont.) • Consider the particle-model motion diagram below showing the distance between successive positions. a. The person is motionless b. Equally spaced images show her moving at a constant speed. c. She is speeding up. d. She is slowing down.
Acceleration SECTION3.1 Nonuniform Motion Diagrams (cont.) • There are two major indicators of the change in velocity in this form of the motion diagram. The change in the spacing of the dots and the differences in the lengths of the velocity vectors indicate the changes in velocity.
Acceleration SECTION3.1 Nonuniform Motion Diagrams (cont.) • If an object speeds up, each subsequent velocity vector is longer. • If the object slows down, each vector is shorter than the previous one.
Acceleration SECTION3.1 Nonuniform Motion Diagrams (cont.) • Both types of motion diagrams give an idea of how an object’s velocity is changing.
Acceleration SECTION3.1 Nonuniform Motion Diagrams (cont.) • For a motion diagram to give a full picture of an object’s movement, it should contain information about the object’s acceleration. • The rate at which an object’s velocity changes is called the accelerationof the object. When the velocity of an object changes at a constant rate, it has a constant acceleration.
You can use a particle motion diagram to draw an acceleration vector for the motion. Acceleration SECTION3.1 Nonuniform Motion Diagrams (cont.)
You can determine the length and direction of an acceleration vector by subtracting two consecutive velocity vectors and dividing by the time interval. Acceleration SECTION3.1 Nonuniform Motion Diagrams (cont.) ________ _____________
Acceleration SECTION3.1 Nonuniform Motion Diagrams (cont.) • The time interval, Δt, is 1 s. This vector, (vf - vi)/1 s, shown in violet, is the average acceleration during that time interval. • The velocities vi and vf refer to the velocities at the beginning and end of a chosen time interval.
You need to know the direction of both the velocity and acceleration vectors in order to determine whether an object is speeding up or slowing down. When the acceleration of an object is in the same direction as its velocity, the object’s speed increases. When the acceleration of an object is in the opposite direction, the object’s speed decreases. Acceleration SECTION3.1 Direction of Acceleration
Acceleration SECTION3.1 Direction of Acceleration (cont.)
An object has a positive acceleration when the acceleration vector points in the positive direction and a negative acceleration when the acceleration vector points in the negative direction. The sign of the acceleration alone does not indicate whether the object is speeding up or slowing down. Acceleration SECTION3.1 Direction of Acceleration (cont.)
Acceleration SECTION3.1 Velocity-Time Graphs • You can determine the acceleration from a velocity-time graph by calculating the slope of the data. Click image to view the movie.
Acceleration SECTION3.1 Average and Instantaneous Acceleration • The average acceleration of an object is the change in velocity during some measurable time interval divided by that time interval. • A curved line on a velocity-time graph shows that the acceleration is changing. • The slope indicates the average acceleration during a time interval that you choose.
Acceleration SECTION3.1 Average and Instantaneous Acceleration (cont.) • Average acceleration is measured in m/s2. • The change in velocity at an instant of time is called instantaneous acceleration.
Acceleration SECTION3.1 Average and Instantaneous Acceleration (cont.) • The instantaneous acceleration of an object can be found by drawing a tangent line on the velocity-time graph at the point of time in which you are interested. The slope of this line is equal to the instantaneous acceleration.
Acceleration SECTION3.1 Velocity and Acceleration How would you describe the sprinter’s velocity and acceleration as shown on the graph?
Acceleration SECTION3.1 Velocity and Acceleration (cont.) Step 1: Analyze and Sketch the Problem From the graph, note that the sprinter’s velocity starts at zero, increases rapidly for the first few seconds, and then, after reaching about 10.0 m/s, remains almost constant.
Acceleration SECTION3.1 Velocity and Acceleration (cont.) Identify the known and unknown variables. Known: v = varies Unknown: a = ?
Acceleration SECTION3.1 Velocity and Acceleration (cont.) Step 2: Solve for the Unknown
Acceleration SECTION3.1 Velocity and Acceleration (cont.) Draw a tangent to the curve at t = 1.0 s and t = 5.0 s.
Acceleration SECTION3.1 Velocity and Acceleration (cont.) Solve for acceleration at 1.0 s:
Acceleration SECTION3.1 Velocity and Acceleration (cont.) The slope of the line at 1.0 s is equal to the acceleration at that time.
Acceleration SECTION3.1 Velocity and Acceleration (cont.) Solve for acceleration at 5.0 s:
Acceleration SECTION3.1 Velocity and Acceleration (cont.) The slope of the line at 5.0 s is equal to the acceleration at that time.
Acceleration SECTION3.1 Velocity and Acceleration (cont.) The acceleration is not constant because it changes from 2.9 m/(s2) at 1.0 s to 0.03 m/(s2) at 5.0 s. The acceleration is in the direction chosen to be positive because both values are positive.
Acceleration SECTION3.1 Velocity and Acceleration (cont.) Step 3: Evaluate the Answer
Acceleration SECTION3.1 Velocity and Acceleration (cont.) Are the units correct? Acceleration is measured in m/s2.
Acceleration SECTION3.1 Velocity and Acceleration (cont.) Step 1: Analyze and Sketch the Problem Step 2 Solve for the Unknown Draw a tangent to the curve at t = 1.0 s and t = 5.0 s. Solve for acceleration at 1.0 s. Solve for acceleration at 5.0 s. The steps covered were:
Acceleration SECTION3.1 Velocity and Acceleration (cont.) Step 3: Evaluate the Answer The steps covered were:
Acceleration SECTION3.1 Calculating Acceleration • Remember that acceleration of an object is the slope of that object’s velocity v. time graph. • On a velocity v. time graph, slope equals:
Acceleration SECTION3.1 Acceleration with Constant Speed • Acceleration can occur when speed is constant. • Consider a satellite orbiting around Earth at a constant speed. • Even though speed is constant, direction is changing so the velocity is changing. • If velocity is changing, then there is acceleration.
Section Check SECTION3.1 Which of the following statements correctly defines acceleration? • Acceleration is the rate of change of displacement of an object. • Acceleration is the rate of change of velocity of an object. • Acceleration is the amount of distance covered in unit time. • Acceleration is the rate of change of speed of an object.
Section Check SECTION3.1 Answer Reason:The rate at which an object’s velocity changes is called acceleration of the object.
Section Check SECTION3.1 What happens when the velocity vector and the acceleration vector of an object in motion are in the same direction? • The acceleration of the object increases. • The speed of the object increases. • The object comes to rest. • The speed of the object decreases.
Section Check SECTION3.1 Answer Reason:When the velocity vector and the acceleration vector of an object in motion are in the same direction, the speed of the object increases.
Section Check SECTION3.1 On the basis of the velocity-time graph of a car moving up a hill, as shown on the right, determine the average acceleration of the car? • 0.5 m/s2 • -0.5 m/s2 • 2 m/s2 • -2 m/s2
Section Check SECTION3.1 Answer Reason:Average acceleration of an object is the slope of the velocity-time graph.
Motion with Constant Acceleration SECTION3.2 MAIN IDEA For an object with constant acceleration, the relationships among position, velocity, acceleration and time can be described by graphs and equations. • What do a position-time graph and a velocity-time graph look like for motion with constant acceleration? • How can you determine the displacement of a moving object from its velocity, acceleration and time? • What are the relationships among position, velocity, acceleration and time? Essential Questions
Motion with Constant Acceleration SECTION3.2 • Review Vocabulary • Displacement a change in position having both magnitude and direction: it is equal to the final position minus the initial position.
Motion with Constant Acceleration SECTION3.2 Position with Constant Acceleration • The position data at different time intervals for a car with constant acceleration are shown in the table. • The data from the table are graphed as shown on the next slide.
Motion with Constant Acceleration SECTION3.2 Position with Constant Acceleration(cont.) • The graph shows that the car’s motion is not uniform: the displacements for equal time intervals on the graph get larger and larger. • The slope of a position-time graph of a car moving with a constant acceleration gets steeper as time goes on. • For an object with constant acceleration, the position-time graph is a parabola.