Thinking Spatially
Thinking Spatially. That’s what we use maps for!. Map Projections and types of maps – The “where” of Geography. Map projection is the way we fit earth’s three-dimensional surface onto flat paper or a screen. Problems with distortion. Shape Distance Relative Size Direction.

Thinking Spatially
E N D
Presentation Transcript
Thinking Spatially That’s what we use maps for!
Map Projections and types of maps – The “where” of Geography
Map projection is the way we fit earth’s three-dimensional surface onto flat paper or a screen
Problems with distortion • Shape • Distance • Relative Size • Direction
Goode’s projection interrupts the oceans and tucks Australia and New Zealand farther west than in reality. Therefore, land masses appear relatively large compared to the oceans. • Minimized distortion in the shape of the various land masses and the size of one land mass compared to other land masses.
Mercator Projection • Stretches the poles from one length to the size of the equator. The north-south scale is constant, but east-west scale increases to twice the north-south scale at 60 degrees N and infinitely at the poles. • Shapes are correct for all areas, and map has correct directional relationships. • Look at the size of Greenland and Antarctica. • Map exaggerates the distance between Chicago and Stockholm, both in northern latitudes.
Equal Area Projection • Represents areas correctly, but distorts shapes. • If South America is 8 times larger than Greenland on the globe, it will be 8 times bigger on the map.
Robinson Projection • Frequently used. • Distorts both size and shape, but not too much. • The major benefit of the Robinson projection is that oceans are uninterrupted. This projection is useful in depicting patterns of global interaction.
Map Type – you can display the same information on different maps • A thematic map depicts a single feature, for example: climate, population, landform or land use. • Statistical – Demonstrate information - include dot, choropleth and proportional symbol • Types of maps: • Isoline – connects points of equal value • Choropleth – puts features into classes and then maps classes for each region • Cartogram – adjusts the size of the country corresponds to the magnitude of the mapped feature • Proportional symbol – size of the symbol corresponds to the magnitude of the mapped feature • Dot – each dot represents some frequency
Choropleth – puts features into classes and then maps classes for each region
Proportional symbol – size of the symbol corresponds to the magnitude of the mapped feature
Cartogram – adjusts the size of the country corresponds to the magnitude of the mapped feature
Dot – each dot represents some frequency Chart Map
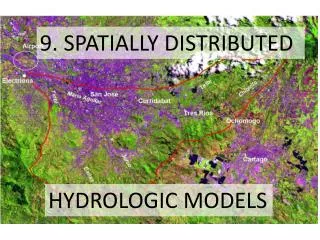
Thematic- spatial distribution of one or more specific themes
The acquisition of data about Earth’s surface from a satellite orbiting the planet is called remote sensing.
Space/Location • Distribution – the arrangement of a feature in space. Three properties • Density – the frequency with which something occurs. • Concentration – the extent of a feature’s spread over space. Used to describe changes in distribution. • Clustered • Dispersed • Pattern – geometric arrangement of objects in space.
Bottom line: hundreds of decisions are made in the making of a map, including scale, projection, and type. These decision ultimately determine the map’s message.
Where? Why there? • There are many reasons for the patterns that you will see on maps • Types of patterns: • Space: Gap or interval between two objects • Connections: Relationships between people and objects across space • Types of distribution • Density • Concentration • Pattern
Globalization • The spread of ideas throughout the entire world • McDonalds • “Globalization means that the scale of the world is shrinking – not literally in size… but in the ability of a person, object or idea to interact with a person, object, or idea in another place.”
Transnational Corporations • A company that is spread throughout the world. Their headquarters may be in a different place than their manufacturing plants. Their customer service line may be in even another country.
Culture • The body of customary beliefs, material traits, and social forms that constitute the distinct tradition • What do people care about? • What do people take care of? • How can we “think spatially” about culture?
What people care about • Beliefs • Language • Religion • Ethnicity
What people take care of • Material possessions • Food • Clothing • Shelter • Government that protects (or doesn’t protect) things like material possessions • Are the people represented? • What are the benefits of being a citizen?
MDC: More developed country • LDC: Less developed country • What makes a country developed? • Education, health care, government, safety • Name some countries that would be MDCs and name some LDCs
Density • Geographers care about “space”. The arrangement of features within space is called DISTRIBUTION • DENSITY is the frequency with which something is distributed in space
Arithmetic Density • Most often used • Total number of objects in an area • People per square mile or kilometer • Why is it important to talk about population density rather than just population?
1 million people 1 million people High population doesn’t necessarily mean high density
Physiological Density • The number of people supported by a unit area of arable land • What do we mean by unit area? • What does arable land mean? • This is more about food and the land’s ability to support a population • Influences “carrying capacity • Technology can change this
Agricultural Density • The ratio of the number of farmers to the amount of arable land • Why would we use agricultural density rather than physiological density?
What are the pros and cons of each type of density measurement? • Choose three countries and quickly analyze their population density data: Look at all the information you have and tell me what we can learn.
Physiological Density • The number of people per unit of arableland • Influences “carrying capacity” • Technology can override the negative of this figure
Concentration • How a feature is spread over the space—are houses tight together—CLUSTERED or far apart DISPERSED
Pattern • How are features arranged on the landscape—are they linear? Grid? Irregular? Urban?