Download
1 / 27
270 likes | 287 Vues
This presentation explores the relationship between turnover, senescence, and cancer incidence using data from mice. The findings challenge the common understanding that everyone will eventually get cancer with age.

E N D
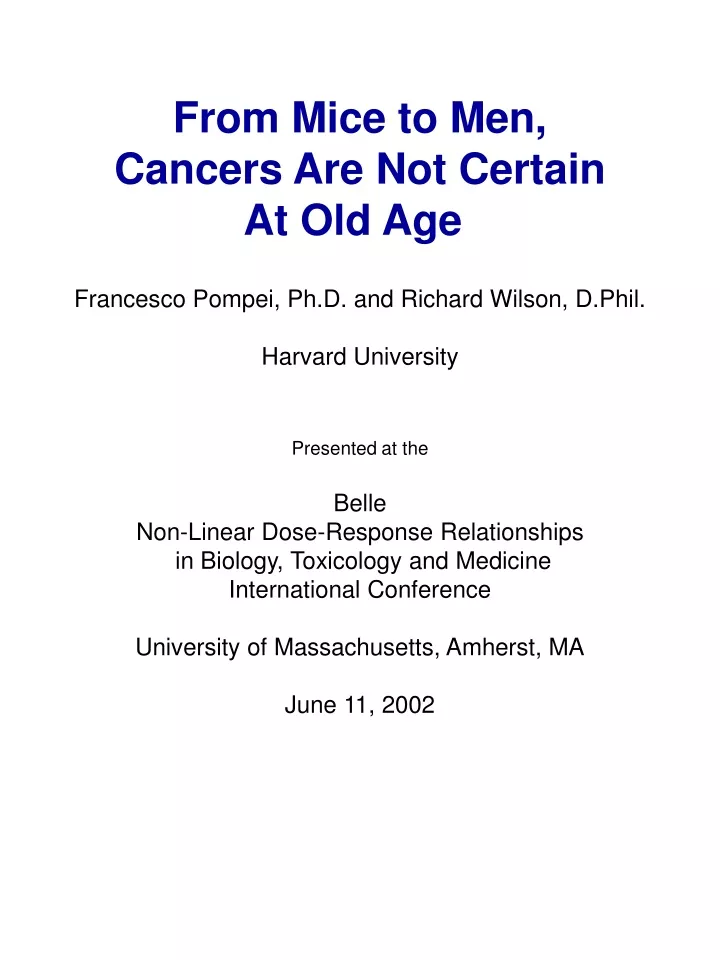
From Mice to Men, Cancers Are Not Certain At Old Age Francesco Pompei, Ph.D. and Richard Wilson, D.Phil. Harvard University Presented at the Belle Non-Linear Dose-Response Relationships in Biology, Toxicology and Medicine International Conference University of Massachusetts, Amherst, MA June 11, 2002
I(t)m1m2 N(s)exp[(a2 - b2 )(t -s)]ds 5000 A-D power law MVK clonal expansion 4500 I(t)=at k-1 Beta-senescence model 4000 SEER (all sites M, F) 3500 3000 Age-Specific Incidence (per 100,000) 2500 I(t)=(at) k-1(1-bt) 2000 1500 1000 500 0 0 20 40 60 80 100 120 Age Age Specific Cancer Incidence for Two Major Historical Models, Compared to SEER Dataand Beta-Senescence Model
Beta Fit to SEER DataAge-specific incidence per 100,000 (Ries et al 2000)
Beta Fit to SEER DataAge-specific incidence per 100,000 (Ries et al 2000)
Beta Fit to SEER DataAge-specific incidence per 100,000 (Ries et al 2000)
Beta Fit to SEER DataAge-specific incidence per 100,000 (Ries et al 2000)
Beta Fit to SEER DataAge-specific incidence per 100,000 (Ries et al 2000) For the 6 gender-specific sites the fits are performed with t = (age-15) 0, as suggested by Armitage and Doll (1954).
Age-Specific Incidence Normalized to the Peak Value for Each Cancer.All Male Sites Except Childhood Cancers (Hodgkins, Thyroid, Testes).
Estimated Lifespan Probability of Cancer: Area Under the Curve • Males • Any specific cancer: • Hodgkins Disease = 0.003 -» Prostate = 0.37 • At least one cancer of any type = 0.70 • Females • Any specific cancer : • Hodgkins Disease = 0.002 -» Breast = 0.21 • At least one cancer of any type = 0.53 • Result is contrary to the common understanding: "if a person lives long enough he or she will get cancer," • The data suggest that "if a person lives long enough, he or she may avoid cancer entirely," with about a one in three chance for men and an even chance for women.
Is the Turnover Present in Mice?Mice Data Sources • Need undosed controls data for full natural lifetime (~3 years). • Need sufficient numbers for statistical significance in cancer incidence trends. • NTP data is limited due to 2-year “lifetime”, except rare dietary restricted studies to 1100 days. • ED01 data (courtesy R. Kodell) of 2-AAF included 24,000 single strain female mice, uniform conditions, and allowed to live to 1001 days. • Age-specific mortality is appropriate measure for comparison to human incidence results
ED01 Control Mice Age-Specific Mortality With Beta Function Fit. Error bars = ±1 SEM
ED01 Control Mice Age-Specific Mortality With Beta Function Fit.
Cell Replicative Senescence As Possible Biological Cause of the Turnover • Widely accepted characteristics of replicative senescence: • That cellular replicative capacity is limited has been known for 40 years. • Has been observed in vitro and in vivo for many cell types, both animal and human. • Is closely related to the ageing process. • Is a dominant phenotype when fused with immortal tumor-derived cells. • Considered to be an important anti-tumor mechanism. • Cells senesce by fraction of population, rather than all at the same time. • Senescent cells function normally, but are unable to repair or renew themselves.
Cell Replicative Senescence: Cells Retaining Proliferative Ability Decrease With Number of Cell Divisions.
Cell Replicative Senescence: Increase in Age Decreases the Number of Cells With Replicative Capacity.
Non-senescent cells Cells In Vitro Age (doublings) Cell Replicative Senescence: Beta-Senescence Model Remaining pool of cells able to cause cancer to Cells In Vivo Age (t) Cell fraction retaining proliferative ability = (1-bt) Cancer: I(t) = (at)k-1(1-bt) Longevity: b = to -1
Search for Senescence Interventions to Test the Model:Altered longevity, modeled as to =b-1Altered cancer, modeled as I(t) = (at)k-1(1-bt) • Mice with altered p53 (gene which is well known to influence senescence): set lifetime to = b-1, then calculate cancer. • Mice with long-term dosing of melatonin (known anti-oxidant): set lifetime to = b-1, then calculate cancer. • Mice with dietary restriction (80-90% of 300 biomarkers tested show evidence of slower ageing): set t = ct’, where c is proportional to caloric intake. Also equivalent to replacing a and b with ca’ and c b’ respectively.
Age-Specific Cancer Mortality: Beta and MVK/s Models of Senescence Effects 25 ED01 mice controls (Pompei et al 2001) Beta-senescence model 20 MVK/s model Normal senescence x 0.5 15 per 100 days) Age specific mortality (percent of population at risk 10 Normal senescence 5 Normal senescence x 1.21 0 0 200 400 600 800 1000 Age (days) Influence of Senescence Rate on Age-Specific Cancer Incidence in Mice. Beta model fit to ED01 undosed controls is I(t) = (at)k-1(1-bt), wherea = 0.00115, k-1 = 5, b =0.00108 (Pompei et al 2001). Equivalent MVK-s model fits shown. Senescence rate is the value of parameter b. Senescence rate increase by 21% is calculated from Tyner et al (2002) results of 21% reduction in median lifespan for p53+/m mice compared to normal p53+/+ mice. Senescence rate of 50% is an assumption for p53+/- mice of Tyner et al.
Effect of Senescence on Tumor Probability in Mice 100 Normal senescence Enhanced senescence 90 Reduced senescence 80 70 60 Percent of mice with tumors 50 40 30 20 10 0 p53+/+ Beta-s MVK-s p53+/m Beta-s MVK-s p53+/- Beta-s MVK-s (Tyner (Tyner (Tyner et al et al et al 2002) 2002) 2002) Probability of Tumors in p53 Altered Mice Compared to Beta-s and MVK-s Model Predictions. Modeled lifetime probability of cancer is calculated as Prob = 1-exp[-M(t) dt], where M(t) is age specific mortality. Tyner et al results for p53+/+, p53+/m, and p53+/-are interpreted as normal senescence, 21% enhanced senescence, and 50% reduced senescence respectively. Arrow indicate Tyner data reported as >80% tumor rate.
Age-Specific Cancer Mortality for Female CBA Mice Dosed with Melatonin vs. Controls. Data from Anisimov et al 2001.
Mice Cancer Mortality and Lifetime vs. Senescence p53+/+ mice cancer mortality p53+/m mice cancer mortality 1.4 p53+/- mice cancer mortality p53-/- mice cancer mortality 1.2 p53+/+ mice lifetime 1 p53+/m mice lifetime p53+/- mice lifetime 0.8 p53-/- mice lifetime Cancer moratlity or relative lifetime Melatonin controls cancer mortality 0.6 Melatonin dosed cancer mortality Melatonin controls lifetime 0.4 Melatonin dosed lifetime ED01 mice cancer mortality 0.2 Human cancer mortality Beta-s model of cancer mortality 0 Beta-s model of lifetime 0 0.2 0.4 0.6 0.8 1 1.2 1.4 1.6 ------- Curve fit for lifetime data Normalized senescence Influence of Senescence on Cancer Mortality and Lifetime Data from Tyner et al (2002) for mice with p53+/+, p53+/m, and p53+/-; compared to Beta model predictions. Beta model predictions for cancer mortality are Prob = 1-exp[-M(t) dt]. Beta model predictions for lifetime are calculated as the lesser of: age at which senescence reaches 100% (t = 1/b), or age at which age-specific cancer mortality reaches 80% [M(t) = 0.8]. Human cancer mortality computed from SEER data.
Senescence and Dietary Restriction Liver tumor incidence vs. weight for two studies of control female B6C3F1 mice. Seilkop data based on body weight measured at 12 months, Haseman data based on maximum weekly average weight. The Beta-senescence-time model fit was developed by varying t in proportion to weight.
Senescence and Dietary Restriction Results of five rodent studies of the effect of DR on mean lifespan. The Beta-senescence-time model comparison line is computed by varying t in proportion to caloric intake.
Conclusions • Cancer incidence turnover likely caused by cellular senescence. • Reducing senescence might be an attractive intervention to prolong life, even if cancer is increased. • Dietary restriction might be an example of interventions that both reduce senescence and reduce carcinogenesis. There may be others. • For those interested in this work, we have two published papers and one draft available. Please leave a business card to receive copies.
Is the Turnover Present in Rats? • “Two tons of Rats” study of nitrosamine compounds dosed to Colworth rats. • 4080 total rats in study, 540 in lowest six doses (0 to 0.5 ppm), where there was little measurable effect due to dose. • Results published by Peto et al 1991. • Age-specific mortality (includes morbidity) from liver tumors extracted from published Kaplan Meier cumulative mortality curves.
Rats Liver Tumor Age-Specific Mortality for Nitrosamine Study at Low Doses, Compared to ED01 Mice