Download
1 / 12
120 likes | 138 Vues
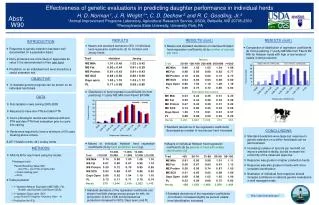
Herds with abnormal data distributions affect bull evaluations, especially when records are concentrated in one "bad" herd. This study compares evaluations from complete vs. partial data, exploring exclusion methods and predicting future evaluations. The findings show improvements in prediction accuracy and correlations when excluding herds with poor score distributions, but raise questions on optimal data exclusion levels and rules. The study aims to refine calving ease evaluations by addressing these challenges.

E N D
Impact on calving ease evaluations of excluding herds with abnormal distribution of scores
The Problem • Herds with unusual distributions of data affect evaluations of bulls • Worst case is when large share of records for a bull are in one “bad” herd • Herd reporting changes over time
Predictability of Future Evaluations • Compare evaluations from complete data to evaluations from partial data • Partial data truncated by: • Date of calving • Goodness of Fit (GoF) exclusion
Methods • Compare correlations of All (A) and Time truncated (T) solutions • Characterize differences in A vs. T evaluations for no herd exclusion (N) vs. GoFn (G) • Comparisons:
Test Edits • Exclude herds with abnormal distributions of scores • Abnormal defined by 2 goodness of fit (GoF) test or multinomial distribution • Population frequencies for parity groups (1 vs. 2+) used as benchmark • Herd test statistics calculated within parity (1 vs. 2+)
Test Edits - c2 GoF statistics GoF1: Obs = actual counts by difficulty score and parity Exp = parity total * parity frequency GoF2: Obs = difficulty score frequency in a parity Exp = population difficulty score frequency within parity GoF1 = GoF3:
Test Edits - c2GoF4 statistics • Based on multinomial distributions • Independent of herd size
GoF Observations • GoF1 primarily excludes large herds • GoF2 primarily excludes small herds • GoF3 seems to exclude bad herds • GoF4 does a better job of excluding bad herds
Percentage of Score by Parity In All (AN) and GoF4 Excluded (AG) Herds 100 Parity 1 - AN 90 80 Parity 1 - AG 70 Parity 2 - AN 60 Counts by Herd-Parity (%) 50 Parity 2 - AG 40 30 20 10 0 1 2 3 4 5 Calving Ease Score
Conclusions • Exclusion of herds with poor distributions improves prediction of future evaluations across birth years • Correlation of PA based on truncated data and final PTA increased when poor data were excluded. • Correlations across all data increased from .66 (PA for TN with PTA for AN) to .68 (PA for TG with PTA for AG) • GoF4 excludes herds with poor score distribution uniformly across herd size • Exclusion of herds results in loss of evaluations for some bulls
Remaining Issues • Optimum amount of data to exclude • Evaluate different fractions of data removal • Strategy for rolling herd exclusions • Rules for return more stringent than exclusion • Interbull test run for calving ease in September