Download
1 / 16
180 likes | 265 Vues
Dive into the world of descriptive statistics with a focus on the Marshmallow Test and various measures of central tendency. Learn about mean, median, mode, range, and standard deviation and how they help summarize and interpret data. Discover the strengths and weaknesses of these statistical tools while exploring real-world research scenarios in psychology.

E N D
Psychology and Statistics Marshmallows!!! The Marshmallow Test
Descriptive statistics • describe or summarize a set of data • Two types • Measures of Central Tendency • Measures of Variance
3 Measures of Central Tendency • Mean • Median • Mode
Measures of Central Tendency • Mean • Sum of a set of scores divided by the number of scores. Average score • Most used tendency
Measures of Central Tendency • Mean Weakness: Sensitive to extreme scores 10 students 9 get 90 1 gets 0 Mean: 81
Measures of Central Tendency • Median • Score that divides a frequency distribution exactly in half • 1, 3, 5, 7, 9, 11, 14 • 7
Measures of Central Tendency • Median Strength: Helps eliminate the effects of extreme scores 0,90,90,90,90,90,90,90,90,90 90
Find the Median • 3, 3, 3, 4, 4, 5 • Middle Numbers • Calculate the mean • 3.5
Measures of Central Tendency • Mode • Most frequently occurring score in a distribution • 1, 3, 5, 5, 7 , 8, 10 • 5
Measures of Variance • Simplest • Range • distance between the highest score and the lowest score • Tells how spread out my distribution is overall • Sensitive to extremes
Measure of Variance • Standard deviation • Most widely used • Tells us how much each score compares to the mean • Are scores close to the mean or more spread out? • Calculated by comparing each score to the mean • Larger the standard deviation – more spread out • Smaller the standard deviation – more clustered around the mean
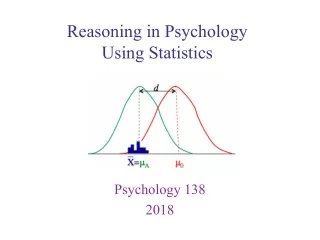
Measure of Variance • Normal distribution • Forms a bell-shaped curve • Mean, mode, and median all at center • Crash Course
Researchers want to investigate the stereotype that women talk more than men. They outfit a large sample of college students with recording devices that automatically record them at random intervals throughout the day. The recorders collect a sample from each individual for the researchers to compare. • IV: • DV:
Cognitive psychologists wonder what kind of diagrams are easiest for people to remember. • IV: • DV: • Physiological psychologists wonder about the relationship between the intake of wine and emotional reactions to frightening stimuli. • IV: • DV:
Comparative psychologist study whether a young monkey will prefer to spend time with a pretend monkey made of wire that also provides milk or a pretend monkey that is covered with cloth but provides no milk. • IV: • DV:
An organizational psychologist test to see if wearing name tags make the employees happier with their work. • IV: • DV: • Developmental psychologists want to know if exposing children to public television improves their reading skills. • IV • DV