Download
1 / 27
270 likes | 447 Vues
Figure from Press and Seiver?. From Horowitz et al., 1990; Horowitz, 1991. Sampling Method Arkansas River, Data from Horowitz et al., 1990; figure from Horowitz, 1991. D.I – Depth integrated sample D-50 – Equal discharge increment vertical taken 50 ft from left bank

E N D
Sampling MethodArkansas River, Data from Horowitz et al., 1990; figure from Horowitz, 1991 D.I – Depth integrated sample D-50 – Equal discharge increment vertical taken 50 ft from left bank P – point sample obtained at 20 % depth, 54 ft from left bank B – 65 – Pump sample obtained 20 % of depth, 65 ft from left bank D-75 – Equal discharge increment vertical taken 75 feet from left bank
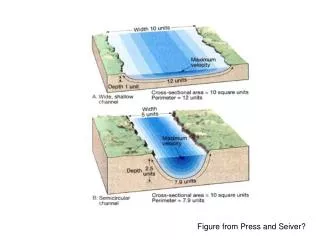
Spatial Variations in Channel Velocities Modified from Wolman, 1955; Figure from Ritter et al., 2002
Horizontal Variations in Suspended Sediment Concentrations(Arkansas River, Data from Horowitz et al., 1990) Feet from Left Bank Figure from Horowitz, 1991
Vertical Variations in Suspended Sediment Concentrations(Cowlitz River, from Horowitz, 1991)
Horizontal Variations in Trace Metal Concentrations(Arkansas River, Data from Horowitz et al., 1990) Feet from Left Bank Figure from Horowitz, 1991
Vertical Variations in Trace Metal ConcentrationsCowlitz River, From Horowitz, 1991
Temporal Variations at a StationArkansas River, Data from Horowitz et al., 1991; figure from Horowitz, 1991
Ba Na K As Dissolved Form Concentration (ng/L) Sr Co 108 105 Li 107 Cd 104 106 103 105 Mn 102 104 Fe Cu 101 Dissolved Form Concentration (ng/L) 103 Cr 100 102 Th 10-1 U 100 101 102 103 Water Discharge (m3/sec) Water Discharge (m3/sec) 106 105 104 105 104 103 102 103 102 101 100 101 100 10-1 100 100 100 101 101 101 102 102 102 103 103 103 From Nagano, T., Yanase, N.,. Tsuduki, K., and Nagao, S., 2003. Particulate and dissolved elemental loads in the Kuji River related to discharge rate. Environment International 28:649-658, Fig. 6, p. 654.
Types of Hysteresis Effects(adapted from Williams, 1989) Figure from Ritter et al., 2002
Diagram showing possible transport pathways of solutes within the hillslope hydrological system (modified from Burt, 1996; Buttle, 1994, and Burt and Pinay, 2005).
From Evans, C., and Davies, T.D., 1998. Causes of concentration/discharge hysteresis And its potential as a tool for analysis of episode hydrochemistry. Water Resources Research, 34:129-137, fig 2, p. 131, and fig. 4, p. 132.
From Shiller A.M., Dissolved trace elements n the Mississippi River: Seasonal, Interannual, and decadal variability. Geochemica et Cosmochimica Acta 61:4321-4330, fig. 1, p. 4322.
From Brick, C.M, and Moore, J.N., 1996. Diel variation of trace metals In the Upper Clark Fork River, Montana. Environmental Science and Technology, 30:1953-1960, fig. 2 and fig. 3, pg. 1955.
From Sullivan, A.B., Drever, J.I., and McKnight, D.M., 1998. Diel variation in element concentrations, Peru Creek, Summit County, Colorado. Journal of Geochemical Exploration 64:141-145, fig. 6, p. 144.
From Brick, C.M, and Moore, J.N., 1996. Diel variation of trace metals In the Upper Clark Fork River, Montana. Environmental Science and Technology, 30:1953-1960, fig. 8, pg. 1958.
Variations in Suspended SedimentConcentration with Discharge
Types of Hysteresis Effects(adapted from Williams, 1989) Figure from Ritter et al., 2002
1941 Flood, San Juan River(data from Leopold and Maddaock, 1953) Figure from Ritter et al., 2002
Controls on Suspended Sediment Concentration-Discharge Relationships • Intensity and areal distribution of precipitation event; • The amount and rate of runoff; • Distance of the sampling site from sources of water and sediment production (upland areas); • Differences in the transport rates between water and sediment; • The amount of sediment stored within and along the channel; and • The depletion of easily eroded debris within the channel or the surrounding uplands
Figure from Salomons, W. and Eysink, Q., 1981. Pathways of mud and particulate trace metals from rivers to the southern North Sea Basin. Special Publication of the International Association of Sedimentology 5:429-450.
Figure from Richards, R.P., 2001. Estimation of pollutant loads in rivers and streams. A guidance document for NPS programs. Report to the USEPA, Region VIII, Grant No. X998397-01-0, fig. 2a, p. 8 (government doc., no permission needed).