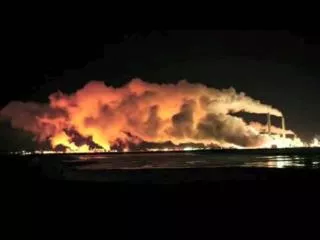
Severe Weather
Severe Weather . Bause/Bellore North Farmington High School Weather & Climate/Geophysical Science. What to look for. What is in a cumulonimbus cloud How to identify aspects of severe weather. Thunderstorm Diagram. Wind Flow Diagram. Top View. Towering Cumulus. Cumulonimbus .

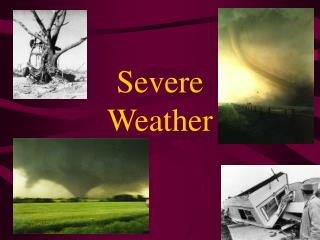
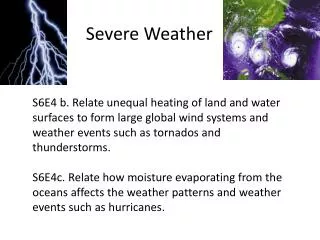
Severe Weather
E N D
Presentation Transcript
Severe Weather Bause/Bellore North Farmington High School Weather & Climate/Geophysical Science
What to look for • What is in a cumulonimbus cloud • How to identify aspects of severe weather
Anvil Head • Produced when air temp inside cloud is the same as temp outside of cloud. Will not rise any further • Extends horizontally
Overshooting Top • Strong updrafts of air may be able to extend past equilibrium. • Usually last a few seconds • If it persists (10 minutes or more) watch out. Strong updrafts and severe weather! Hail, tornadoes, lightning, AHHHH!!!!
Flanking Line • Area of updraft. • Possible source of new updraft cells. Gives birth to new thunderstorms. • You can see a progression of like. Baby cell, mature cell, and old (dissipating) cell.
Mature cell begins to dissipate. Tower becomes more dominant.
Mature cell completely dissipated. Tower is now dominant updraft.
Shelf Clouds • Rain cooled air is cooler (therefore more dense) than the air around it. Cooler air will sink (gust front). • Precipitation occurs here, but no tornadoes. • Shelf cloud is attached to the base of the parent cloud above it.
Mammatus Clouds • Occurs in the anvil. Air is forced down to form “sacks” • Can appear dark and threatening. Sign that the storm is well into mature stage (maybe dissipating) • Not always found in cumulonimbus
Rain Free Base • Below main storm tower • Flat cloud base • Marks the area of intake (updraft) • Lightning dangerous area! • Possible tornado area!!!
Wall Clouds aka “Lowerings” • Areas of strongest updraft. • Warm, moist air rises in the updraft and cools below rain free base forming a wall cloud. • Usually rotating (due to low pressure) • Tail clouds can be attached. Points towards precipitation and is often confused for a tornado. • Tornadoes tend to form from the wall cloud.
Tornadoes • Violent rotating (CCW) column of updraft more than 50% to the ground. (less than 50% is called a funnel cloud). • Winds in most tornadoes blow at 100 mph or less, but in the most violent, and least frequent, wind speeds can exceed 250 mph. • Track along the ground for a few miles or less and are less than 100 yards wide, though some monsters can remain in contact with the earth for well over fifty miles and exceed one mile in width!
Tornadoes • Tornado classification is designated by the Fujita scale • F0-F5 classifies tornadoes by the damage they inflict. Can only be determined after the storm has finished. • Winds speeds are estimated in scales, but not precisely calculated. • Different wind speeds can cause similar looking damage.
Doppler Radar • Cut warning time from seconds to minutes because it can measure wind speed/direction. • All radars can show location and intensity of precip. Precipitation reflect radio waves. More precip, more reflection shows up on radar. • Doppler is special. It can measure wind speed and direction. This is key in identifying possible sources of tornadoes.