Area of Shaded Sectors: Analyzing Graphs and Functions
This lesson covers the area of shaded sectors in a circle with a 1-inch radius, focusing on calculating the area based on an angle ( x^circ ). It presents two different cases on a standard (x,y) coordinate plane, asking students to identify the correct graph representing the area of the shaded sector as ( x ) ranges from 0 to 360 degrees. Additionally, the lesson introduces concepts of bounded functions, local and absolute extrema. Students will explore these concepts through examples and practice problems, enhancing their understanding of graphing and function analysis.

Area of Shaded Sectors: Analyzing Graphs and Functions
E N D
Presentation Transcript
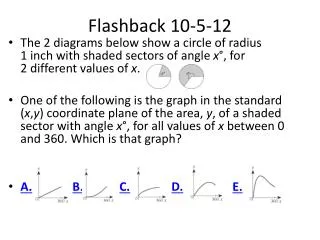
Flashback 10-5-12 • The 2 diagrams below show a circle of radius 1 inch with shaded sectors of angle x°, for 2 different values of x. • One of the following is the graph in the standard (x,y) coordinate plane of the area, y, of a shaded sector with angle x°, for all values of x between 0 and 360. Which is that graph? • A.B.C.D.E.
Joke of the day What do you call a crushed angle?
Bounded functions • Function is bounded above if there is some number that is greater than or equal to every number in the range of the function. • Function is bounded belowif there is some number that is less than or equal to every number in the range of the function. • Function is bounded if the function is bounded above and bounded below.
How do we know? • Check graph • i.e. w(x) = 3X2 – 4 • Confirm algebraically:
Local and absolute extrema • Local maximum: f(c) is the largest range value over an open interval that contains c. • Local minimum: f(c) is the smallest range value over an open interval that contains c. • Absolute Maximum: f(c) is the largest range value over the entire range of the function. • Absolute minimum: f(c) is the smallest range value over the entire range of the function.
Try one • F(x) = X4– 7x2 + 6x • Enter into calculator.
HW: p. 102 Ex. 25-28, 30,32, 36,38,42,44
Exit Slip p. 104 #84