Download
1 / 104
1.04k likes | 1.66k Vues
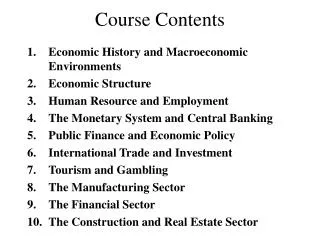
Course Contents. Economic History and Macroeconomic Environments Economic Structure Human Resource and Employment The Monetary System and Central Banking Public Finance and Economic Policy International Trade and Investment Tourism and Gambling The Manufacturing Sector

E N D
Course Contents • Economic History and Macroeconomic Environments • Economic Structure • Human Resource and Employment • The Monetary System and Central Banking • Public Finance and Economic Policy • International Trade and Investment • Tourism and Gambling • The Manufacturing Sector • The Financial Sector • The Construction and Real Estate Sector
1. Economic History and Macroeconomic Environments • What kind of an economy is Macau? • How does Macau get to the current point of economic development?
1.1 The Macau Economy • A “mini” economy located at the west coast of the Pearl River. • Definition of mini economies: (i) population<1 million, (ii) independent economic institutions, (iii) international recognition as an independent economic unit.
Optimal Development Strategy • Outward looking (Reliance on external resources). • Export-oriented (Reliance on external markets). • Specialization (Leading industry).
The Family of Mini Economies • Over 200 economies. • 56 potential “minis” locating in Asia Pacific, Europe, Africa and Latin America. • Accounting for less than 1% of world population and world area. • Small is beautiful: High or medium income the majority, the wealthiest in the world (Luxembourg), 5 (2) among top-ten wealthy economies in terms of GNI (PPP) per capita.
How about Macau? • Lack of natural resources. • Sea, advantageous geographical location, human resources. • Latest population = 445 thousands (with the highest population density in the world), of which about 215 thousands economically active. • GDP about 20% of Beijing’s, 4% of HK’s. • High-income defined by World Bank since 1994. • GDP per capita=US$15,432 in 2002 (4th in Asia; 42nd in the world).
Laissez-faire Example • Low, simple and “relaxed” tax system. • Absence of meaningful capital control. • Minimum government intervention in economic activity (except casino). • Pessimism Vs positive non-interventionism. • Modification since the 1980s: increasing public sector’s share of real GDP (about 13% in 2002).
Outward Looking and Domestic Policy • Visible trade relies on the US, western Europe and China. • Invisible trade relies on China, Hong Kong and Taiwan. • Inward direct investment relies on Hong Kong (71%), China (11%) and Portugal (10%). • Pataca linked to HKD. • ΔG has little multiplier effect.
1.2 The Past • An economic history of 450 years. • Portuguese arrived at the fishing village with a population of 400 in the 16th century (1557). • Paid an annual “ground rent” to the Ming government. • China recognised Portugal’s sovereignty over Macau in the 19th century (1887). • Portugal recognised Macau’s status as a Chinese territory under Portuguese administration (until 20 December 1999).
Before the Opium War (1840) • Portuguese-promoted trade centre with a population of 13,000 (1839). • First entrance to China’s market for western merchants. • Position strengthened in the 18th century due to the closed door policy by the Qing government. • Trade links: China-Macau-India-Portugal, China-Macau-Japan, China-Macau-Philippine Islands- Mexico. • Goods traded: silk, silver, gold, opium.
After the 19th Century • Status as a major trade and commercial centre in China lost to Hong Kong. • In 1850, only 2% of foreign traders in China resided in Macau. • Failed to establish economic foundation for future, sustainable development.
What’s Wrong? • Increase in competition from other Chinese coastal cities after the Opium War. • Lack of direct transportation links with the outside world. • The decline of Portugal, the rise of Britain in Asia. • Lack of effective capital accumulation. • Over-reliance on China trade and commerce.
What’s Left? • Trade restricted to Canton and HK areas. • Refocused on fishing (fishermen=over 70% of Macau’s population in the 1920s). • Introduced a licensing system for fantan. • Opium smuggling and “pig shops” or coolie trade. • Traditional industries such as matches, fire works, shipbuilding, incense. • Temporary boom during WWII.
After WWII • Massive outflows of population and capital. • Population dropped from the all-time high of 600,000 to 187,000 in 1950. • UN embargo due to the Korean War.
1950s and 1960s • Modern industries in particular textiles developed due to Portugal’s duty-free privileges. • S.T.D.M. replaced Tai Hing Co. of the Fu family. • Western-style games, fleet of jetfoils, millions of gamblers from HK, huge tax contribution and re-investment requirements.
Take-off: 1970s and 1980s • Hong Kong industrialists established “out-processing facilities” (low-cost operating environments and industrialized countries’ preferential treatments). • Exports diversified from Portugal-related markets to North American and western European markets. • Number of manufacturing establishments: 172 (1961), 870 (1978), 2,300 plus 1,000+ unregistered “family factories” (mid-1980s).
Manufacturing-driven Growth • Manufacturing accounted for 40% of Macau’s GDP in the golden period (mid-1980s). • Textile and garments dominated (90% of total visible exports in late-1970s). • 1971-81: average annual growth = 16.7% > 10.4% in Hong Kong. 1983-1990: average annual growth=7.6%. • Manufacturing-led demand for services: Modern banking law (Decree Law No. 35/82/M); No. of banks: 10 (1970s), 21 (end-1980s).
1990s • Consistent contraction in manufacturing and correspondingly, significant slowdown in visible exports growth. • Increasing reliance on gambling (plus hotels, restaurants and retail commerce). • The rise of some other tertiary production such as banking and insurance. • Construction and real estate saw ups and downs.
What’s Wrong with Manufacturing? • Relocation to southern China. • Reduction in preferential treatments and protectionism spreading to Macau. • Failure to upgrade competitiveness by quality and technological advancement (SMEs? HK-based large factories?)
2. Economic Structure • Structural importance measured by share of GDP, share of employment and share of exports. • In 2001: Secondary=13.6% of GDP, Tertiary=86.4%.
Primary Production • Fishing, farming • Stimulating impact on some secondary and tertiary industries such as seafood manufacturing and trading, ice factory and storage. • Reasons for its decline: harbour pollution, reclamation projects, short supply of labourforce, keen competition from China. • Employment: about 300 (0.1). • Domestic seafood meets 5% of domestic demand.
Secondary Production: Manufacturing • The largest component of secondary production. • Over 95% outputs exported. • GDP share dropped rapidly from 20.3% in 1989 to 8.5% in 2001. Employment share dropped from 33% (early 1990s) to about 20% (about 40% are imported workers). • Exports in goods=35% of total exports in real terms (2002). • Lowest value added among all major economic sectors (22.7% in 2001).
Construction • A contracting industry in the 2nd half of 1990s due to excess supply, completion of major public projects, withdrawal of speculative funds, significant reduction in immigrants. • Contribution to GDP: from 4.7% (1989) to 2.0% (2001). Employment share: 7.5% (2002). • Part of exports in non-industrial services if foreigner purchases.
Electricity, Gas and Water • Import-oriented, with major valued added by Macau Electricity Co. (CEM). • GDP share: stabilised at 2-3% in the past decade. • Employment share: 0.6% of total employed workers.
Tertiary Production • Gambling dominated. • Included in “Public Administration, Other Community, Social and Personal Services” and accounted for about 32% of Macau’s GDP (2001). • Gambling tax contributes to about 70% of government revenues which finance “public administration (9.4%) and education (3.4%). • Tertiary production with higher value added (over 60% of gross output) and larger operating surplus (about 67% of value added).
Over 10 million visitors/year generate production in “Wholesale, retail, restaurants & hotels” (about 12% of GDP) and “Transport, Storage and Communications” (about 7% of GDP). • Fair estimate: Gambling and tourist industry contributes to over half of the GDP. • Employing over 70% of workforce. • Exports in gambling & tourist services about 60% of total exports.
Highly Concentrated Structure • Tertiary production over 80% of GDP, over half of exports, over 70% of employed population. • Likely to increase further at the expense of manufacturing. • Tertiary depends on gambling and tourism. • Services exports depend on gambling and tourism (over 90%).
Low Professional Requirement • Technology- or knowledge-based tertiary production in developed countries, but not in Macau. • Over 35% workforce has primary education or below, only 10% has university education or above. • Possible reasons: dominance of gambling (a fairly ordinary, low-technology industry) and public services (non-market-driven sector).
Rapid Structural Change • Secondary production accounted for 27.5% of GDP in 1989, but only 13.6% in 2001 - a loss of 14 percentage points in 12 years. • +ve: high flexibility (arguably strength of mini economies). • -ve: lacking of solid foundation, long-term investment commitment and specialised skills.
Corresponding Shift in Export Structure • Services started to exceed goods in 1991. • Exports in industrial services recorded little growth in real terms in the 1990s. • Exports in tourist services grew relatively strong particularly in the area of non-gambling expenditure by non-residents. • Exports in non-industrial services with low base but grew by over 1,000% in last decade!
Threat of Structural Unemployment • Productivity of manufacturing workers lower than that of workers in tertiary industries. • Upgrade of labourforce keeps pace with the structural change? • If not, unemployment increases as manufacturing contracts (with imported workers as a cushion). • Hindrance of economic growth (in tertiary sector).
3.1 Macau’s Population Cultural Revolution Return to Mainland after 1949 Inflows of Chinese immigrants WWII
Population Development • Increased from about 340 thousand in the early 1990’s to about 450 thousand currently, with about 96% Chinese (born in Macau and Mainland China), and less than 2% Macaense. • Natural factor only accounts for less than half of the increase; net migrants remain the major contributor to population growth. • Population inflows: legal immigrants and imported workers mainly from Mainland China, foreigners permitted to reside in Macau mainly from Hong Kong.
Highest Population Mobility • Highest portion of foreign-born population: 56% (Hong Kong, 40%; Region of Gulf Cooperation Council, 35%). • Census 2001: 47% Macau residents from Mainland China (Hong Kong, only 35%). • New immigrants: 15% residents have stayed in Macau for less than 10 years. • Economic and social impacts.
Population Quality • Dependency ratio=38.3% in 2002, which has been slightly reduced in recent years. • Ageing index on an increasing trend (from 27.2% in 1993 to 38.4% in 2002) → higher dependency ratio in the future and reduced number/growth of economically active population. • Less-educated population has consistently reduced from close to 90% in the early 1990s to below 80% in recent years.
Population Projection (2001-2026) • From less than 450 thousand to 578 thousand in 2026 at an average growth of about 1%. • Increasing proportion of female pop. (from 100:92 to 100:88) • Aging population (from less than 10% to 20%) • Median age of residents from 34 to 40. • Life expectancy reaching 80 for men and 85 for women (increase of about 3 years)
3.2 Labour • Labourforce determined by population and labour participation rate. • Labourforce = 45-50% of the population in the last decade. • Labourforce: about 214 thousands with labour participation rate reduced from the high of 66% in the middle of the 1990s to slightly higher than 60% in recent years. • Employed population: about 200 thousands (11% self-employed or family-employed).
Labour Quality • Defined by productivity. • Education attainment. • Age. • Health. • Skill. • Flexibility. • Professional qualifications and continuous training.
3.3 Employment • Employment, wage and productivity. • Underpaid? overpaid? (wage/output ratio comparison; wage index vs productivity index). • Productivity and wage highly correlated; productive workers well worth to be employed. • Wage “catch-up” for low-productivity sectors? • Labour Importation → ↑cost competitiveness?
Monetary System in Macau • The Silver Standard (Before 1906). • The Silver Standard and the Escudo Standard (1906-1941). • The “Pataca” Standard (WWII). • Gold Exchange Standard and the Escudo Standard (1946-1973). • The Escudo Standard (1973-1977). • The HKD Standard (1977-1983). • The HKD Standard and the USD Standard (1983-).
4.1 Silver Standard • A monetary system similar to those in Mainland China, Hong Kong and other Asian countries. • Chinese silver ingots & coins, Mexican Eagle dollars, silver-backed pantans, Hong Kong’s silver-backed banknotes. • Supply of money determined by the amount of silver stock in Macau.
4.2 Silver Standard and Escudo Standard • Patacas issued by BNU circulated in 1906. • Patacas with a guaranteed silver content, linked to the Escudo (under the Gold Standard) at a fixed rate of Ptc1:Esc5. • BNU required to keep monetary reserves ≧ 1/3note issues. • Exchanged for HKD in unofficial/open markets at the rate of 1:1 roughly. • Patacas poorly received and the fixed exchange rate between pataca & escudo only applied to a limited number of official transactions.
4.3 “Pataca” Standard • HKD and Chinese money lost value during wartime. • Link to escudo disturbed. • Concerns for Japanese military yen. • Patacas rose to a popular means of payment, with stern enforcement and substantial reserves (silver and acceptable foreign currencies).
4.4 Gold Exchange Standard and Escudo Standard • Bretton Woods System formally in place. • Macau adhered to the Escudo area with a fixed rate of Ptc1:Esc5.5. • Linked to all major currencies and HKD. • Stable exchange rate with HKD a real priority (devaluation in 1949 and 1967 with HKD).
4.5 Escudo Standard • Portugal notified the IMF to float the escudo. • Pataca devaluated against the HKD with the escudo. • Ptc:HKD exchange rate reached all-time low of 1.21 in 1976. • Serious inflation and disturbance to the daily business activity.
4.6 HKD Standard • Officially linked to the HKD at the rate of Ptc1.075:HKD1, with a fluctuation margin of ±1%. • End of 71 years’ official link to the escudo. • Pataca floated against major currencies with a floating HKD. • Realignment on several occasions in appreciating direction, and eventually settled at the current rate of Ptc1.03:HKD1. • BNU became the agent of IEM in 1980.
4.7 HKD Standard and USD Standard • HKD linked to USD. • Pataca’s link to HKD maintained following the failure of revaluation attempts. • Introducing the Currency Board System (100% reserve requirement) in 1989 with the establishment of AMCM. • BNU regained its exclusive right to issue banknotes (agent of the government). • BOC became the second note-issuing bank.
4.8 Currency Board System • Different from central-bank issuing system. • Exchange between Certificate of Indebtedness (CIs) and a reserve currency at a fixed rate; 100% back-up by international reserves;full convertibility. • Statutory obligation to issue and redeem the currency on demand against reserve money at a fixed rate of exchange and without limit. • Money supply not determined by the Currency Board, but BOP automatic adjustment rather than central-bank discretion.