Delta TRIM Hydrodynamic modeling in CASCaDE
330 likes | 762 Vues
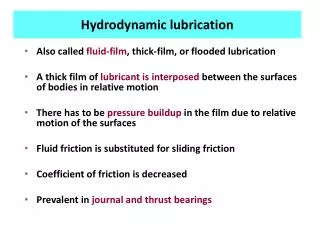
Delta TRIM Hydrodynamic modeling in CASCaDE. Nancy Monsen USGS/Menlo Park IEP Modeling Workshop Tuesday, May 26, 2009. Funding from IEP and CALFED have been critical to the development of Delta TRIM. End date for CASCaDE: September 2009 Future funding: ???.

Delta TRIM Hydrodynamic modeling in CASCaDE
E N D
Presentation Transcript
Delta TRIM Hydrodynamic modeling in CASCaDE Nancy Monsen USGS/Menlo Park IEP Modeling Workshop Tuesday, May 26, 2009
Funding from IEP and CALFED have been critical to the development of Delta TRIM.
End date for CASCaDE: September 2009 Future funding: ??? CASCaDE: Computational Assessment of Scenarios of Change in the Delta Ecosystem
What the model does do: Calculates stage,velocity and scalar concentrations at a 50 m resolution for the entire Delta and Suisun Bay Accounts for real tides and river inflows, gate operations, temporary barriers, and pump operations Delta TRIM Hydrodynamic model References: Casulli and Cattani (1994) {Hydro} Gross (1999) {Scalar Transport} Monsen (2001) {Delta TRIM}
Delta Cross Channel Three Mile Slough Mildred Island Sacramento Delta Study Area
Delta TRIM Model GRID Junction of the Sacramento and San Joaquin Rivers at Three Mile Slough Delta TRIM has a 50 m grid resolution. Velocities are computed on the walls of the computational volume while the stage elevation is computed at the center of the cell. This figure shows the depths specified at the walls of the cells.
Hydrology (Climate Change) Delta Hydrodynamics (Delta TRIM) Phytoplankton (Fish Food) Toxins Clams
Delta Hydrodynamics (Delta TRIM) Clams Is there tidal exchange between the Suisun Bay and Western Delta environments?
Sacramento Flow Tides San Joaquin Flow Ecosystem Response
What we know about the clams: Channel station at Collinsville. Source: Jan Thompson Peaks in Chlorophyll a do not start until Summer/Early Fall in pre-corbula years.
An Observation: “The western Delta stations … exhibit a larger suppression [of Chl a] after 1986 than the upstream stations.” (Jassby et. al 2002) The Working Hypothesis: Tidal mixing between Suisun Bay, where Corbula amurensis grazes, and the Western Delta causes lower Chl a concentrations in the Western Delta. (Kimmerer and Orsi 1996) salt water clam (Corbula amurensis) fresh water clam (Corbiculafluminea)
Numerical “drogues” released at every grid cell (50 m x 50 m) in the Lower San Joaquin & Big Break region
February 1992(Release Day 18) August 1992(Release Day 18)
Model representation of Three Mile Sl. exchange is important for dispersion.
The western Delta is a dispersive environment. Representing the complex junctions is very important in order to understand the mixing interactions between Suisun Bay, open water shallow regions (i.e. Dutch Sl. & Frank’s Tract) and the main river channels. Is there tidal exchange between the Suisun Bay and Western Delta environments? Delta Hydrodynamics (Delta TRIM) Clams
How “well” does the model represent stage elevations? Hydrology (Climate Change) Delta Hydrodynamics (Delta TRIM)
Ecosystem Response
Bathymetry grid referenced to NGVD 1929. Known stage values benchmarked to NAD88. Martinez tide boundary is NOT a benchmark location. IEP changed its method of reporting Martinez stage to NAD88 in 2002 (?) Stage Benchmarks
Hydrology (Climate Change) • Do the models “work” – do they produce useful/reliable information for estuarine management? • Stage: agreement with benchmarked stage visually. • Alternate measurement criteria. Delta Hydrodynamics (Delta TRIM)
Is Delta TRIM’s representation of stages behind temporary barriers sufficient for the phytoplankton model? Delta Hydrodynamics (Delta TRIM) Phytoplankton (Fish Food)
At every grid cell and time step... Hydro model velocities, surface elevations Biomass (B) Net Primary Production (NPP) Linkage Equation Phyto model kt Io rates of growth, respiration, grazing
Depth-averaged light Photosynthesis Water column height Depth-averaged effect of benthic grazers Influence of clams Water column height Depth of the water column is a critical variable in the biomass equation.
Four temporary barriers create a reservoir in the South Delta
Delta Hydrodynamics (Delta TRIM) Phytoplankton (Fish Food) Is Delta TRIM’s representation of stages behind temporary barriers sufficient for the phytoplankton model? • Representing the temporary barriers as overtopping rather than infinite walls, significantly improved the representation of stage in the south Delta. • I am intentionally keeping the representation simple because the barrier configuration changes yearly.
Hydrology (Climate Change) Delta Hydrodynamics (Delta TRIM) Phytoplankton (Fish Food) Toxins Clams
Additional support for maintaining key stations. Martinez (RSAC054) needs redundancy Freeport (RSAC155) Vernallis (RSAN112) Additional flow stations Steamboat Sl Miner Sl Mokelumne system Data distribution to modelers from IEP database Much better interface for downloading data from IEP servers Quality control of CDEC database Valuable information but not in a publishable form Additional sampling for future needs SEDIMENT TRANSPORT Where IEP could support modeling