Study of hydrodynamic cavitation by CFD modeling
771 likes | 2.37k Vues
Study of hydrodynamic cavitation by CFD modeling. Chemical and Materials Engineering University of Alberta. Shaham Hosseininejad Oct 19, 2011. Outline. Background M ilestone Cavitation modeling Cavitation experiments Future work. Background.

Study of hydrodynamic cavitation by CFD modeling
E N D
Presentation Transcript
Study of hydrodynamic cavitation by CFD modeling Chemical and Materials Engineering University of Alberta Shaham Hosseininejad Oct 19, 2011
Outline • Background • Milestone • Cavitation modeling • Cavitation experiments • Future work
Background • Objective: develop a system for enhancing fine particle (less than 10 µm) flotation using microbubbles generated by cavitation
Background • Objective: develop a system for enhancing fine particle (less than 10 µm) flotation using microbubbles generated by cavitation • Mechanism proposed by Zhou et al. 1997 • Hydrophobic particle surface in water is a good nucleation site for cavity generation particle particle tiny bubble tiny bubble Flotation-sized bubbles Enhanced coagulation by Bubble bridging Two stage attachment
Background • Objective: develop a system for enhancing fine particle (less than 10 µm) flotation using microbubbles generated by cavitation
Milestone • Implement cavitation models in commercial CFD softwares • Apply the cavitation model in various systems • High intensity agitation (HIA) cell • Venturi • Orifice • Investigate parameters governing hydrodynamic cavitation • Experimental validation
Milestone • Determine bubble size distribution using population balance equations • Measure bubble size distribution • Couple the cavitation and population balance equations with flow equations • Study floatation recovery
Cavitation models • Schnerr-Sauer model • Bubble number density • Zwart-Gerber-Belamri (ZGB) • Bubble diameter • Evaporation coefficient • Condensation coefficient • Singhal et al. cavitation model • Non-condensable gas fraction
Cavitation models • Multiphase flow • Continuity equation for mixture • Momentum equation for mixture • Cavitation model for vapor phase • Bubble dynamics: growth of cavitation bubbles using Rayleigh-Plesset equation
Cavitation models • vapor transport equation Evaporation rate term Condensation rate term When Pv ≥ P When Pv ≤ P Singhal et al. (2002): Ce=0.02, Cc=0.01
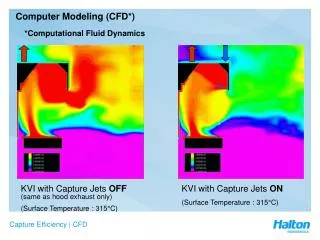
HIA Cell CFD modeling CFD Modeling of cavitation is performed for the laboratory HIA cell for different impeller speeds and different dissolved gas content.
Volume fraction of vapor Contours of pressure and volume fraction of vapor in the HIA cell Pressure
Dissipation Contours of pressure and volume fraction of vapor in the HIA cell Turbulent kinetic energy
Geometries Orifice Venturi
Geometries • Orifice (R/r=2,3, R=2cm) • Venturi (R/r=2, R=2cm) • Contraction (R/r=2, R=2cm) R r R r R r
Pressure drop in venturi and orifice 4 mm 1 mm 4 mm 1 mm
Pressure profile in venturi Our model Hu et al. 1998 • Minimum inlet velocity is 4 m/s for the studied venturi
Pressure and velocity profiles in venturi Single phase model Inlet velocity=4m/s Pressure profile (Pa) Velocity profile (m/s)
Pressure profiles in orifice Single phase model Inlet velocity=4m/s
Multiphase modeling in orifice • Continuity, turbulent flow model and Singhal et al. cavitation model, inlet velocity: 4m/s Vapor fraction
Multiphase modeling in orifice • Continuity, turbulent flow model and Singhal et al. cavitation model, inlet velocity: 4m/s Turbulence kinetic energy
Multiphase modeling in orifice • Continuity, turbulent flow model and Singhal et al. cavitation model, inlet velocity: 4m/s
Multiphase modeling in orifice • Singhal et al. and Zwart-Gelber-Belamri Cavitation models (inlet velocity=4 m/s)
Multiphase modeling in orifice • Continuity, turbulent flow model and Singhal et al. cavitation model, inlet velocity: 4m/s and 4.5m/s
CFD analysis in orifice R/r=3 • Velocity contours in orifice (R/r=3) • Pressure profile • vapor fraction contours Inlet velocity= 4 m/s Max velocity= 51 m/s Max pressure= 1.14 MPa Min pressure= -98 kPa Max vapor fraction= 0.92
Experimental setup 1 • ID= 1 inch • Variable speed pump (0-6 m/s)
Experimental results Flow Flow Kca=1.13 Kca=1.6 Flow Flow Kca=0.84 Kca=1.03
Experimental results Kca=1.13 Kca=2.1 V =2.5 m/s V =3.7 m/s Kca=1.6 Kca=1.03 V =3 m/s V =4 m/s Kca=1.27 Kca=0.84 V =3.5 m/s V =4.5 m/s
Experimental setup 2 • Peristaltic pump • Glass venturi (ID=1mm) • Extech light meter • Laser pointer
Modeling results Vapor volume fraction for venturi (ID=1 mm) V at throat=16 m/s
Experimental setup 3 • Pump: • Centrifugal • Max flow: 66 GPM • Max head: 122 ft • Flowmeter • Coriolis flow and density meter • Tank • 10 L tank
Gas holdup measurements • FBRM • 0.8 to 1000 micron • Inline detection • CCD • 517 fps @ 1280 x 1024 • Min exposure time 1µs R. J. N. Bernier, “Unsteady two-phase flow instrumentation and measurement,” Ph.D. dissertation, Cal.. Inst. Technol., Pasadena, 1982.
Gas holdup measurements • Acoustic spectrometer: Sonartrac • 2”-36” • 1-10 m/s • 1-20 % • 5 % accuracy R. J. N. Bernier, “Unsteady two-phase flow instrumentation and measurement,” Ph.D. dissertation, Cal.. Inst. Technol., Pasadena, 1982.
Gas holdup measurements • Conductivity cell: C: Specific conductivity of the solution G: Measured conductivity of the solution L: Distance between two plates A: area of the plates L/A: cell constant http://www.coleparmer.ca/techinfo/techinfo.asp?htmlfile=Conductivity.htm&ID=78
Future Work Implement experiments to evaluate parameters in cavitation model and population balance model Use UDF in Fluent to model the generation of bubbles Implement the population balance in a bubble-particle environment Determine bubble-particle and particle-particle collision rate (frequency) and efficiency model parameters {experiments} Develop comprehensive model for flotation involving in-situ bubble generation, bubble-particle interaction and the ultimate flotation recovery. Study the effect design and operating parameters on fine particle flotation
Acknowledgements • Financial support for this work from: • NSERC-CAMIRO CRD Grant on Fine ParticleFlotation • NSERC-Industrial Research Chair Program in Oil Sands Engineering.
Cavitation number KCa: Cavitation number P1: Downstream pressure Pv: Water vapor pressure V: Velocity at the throat of the contraction
Tuning parameters in ZGB model Ce=0.02 CC=0.01
Tuning parameters in ZGB model Ce=100 CC=0.001
Tuning parameters in ZGB model Ce=1000 CC=0.0001
Tuning parameters in ZGB model V=6 m/s Ce=0.02 Cc=0.01