Analysis of Student Writing and Math Performance Goals from 2012 Assessments
140 likes | 278 Vues
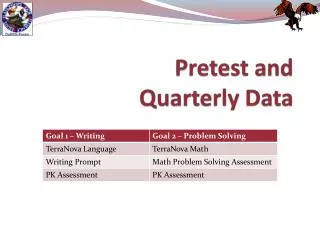
This report evaluates student performance goals for writing and math based on TerraNova and local assessments conducted in 2012-2013. It tracks the percentage of students scoring at or above standards for writing according to various benchmarks and traits, and analyzes problem-solving capabilities through math subtests. The report provides insights on overall scores, benchmark achievements, and item-specific performance across multiple quarters, highlighting areas of success and opportunities for improvement in student learning.

Analysis of Student Writing and Math Performance Goals from 2012 Assessments
E N D
Presentation Transcript
Goal 1 - Writing Percentage of students scoring at or above standard or below standard on the TerraNova Language Subtest, Spring 2012
Goal 1 - Writing Percentage of students scoring at or above Benchmark on Local Writing Prompt, September 2012 and January 2013
Goal 1 - Writing Percentage of students scoring at or above Benchmark by Trait on Local Writing Prompt, September 2012 and January 2013
Goal 1 - Writing Percentage of students scoring at or above Benchmark by Trait on Local Writing Prompt, September 2012 and January 2013
Goal 1 - Writing Percentage of students scoring at or above Benchmark by Trait on Local Writing Prompt, September 2012 and January 2013
Goal 2 – Problem Solving Percentage of students scoring at or above standard or below standard on the TerraNova Math Subtest, Spring 2012
Goal 2 – Problem Solving Percentage of students scoring at or above Benchmark on Local math quarter assessments, November 2012 and January 2013
Reading, Interpreting, and Applying Data • Overall score/percent correct • How many students are scoring in each quarter? • How many students are meeting the benchmark? • How many students are answering each item correctly? • For questions that are worth more than one point, how many students are receiving at least 75% of the available points?