Path to Excellence: Investigating Time Series Data with Statistical Insight
880 likes | 973 Vues
Using statistical enquiry cycle, analyze time series data, integrate statistical & contextual knowledge, and communicate findings for excellence in investigations. Understand truancy & attendance data for insightful research.

Path to Excellence: Investigating Time Series Data with Statistical Insight
E N D
Presentation Transcript
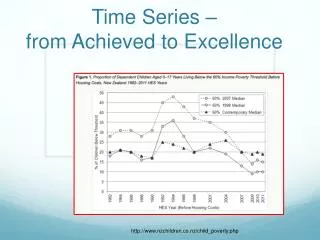
Time Series –from Achieved to Excellence http://www.nzchildren.co.nz/child_poverty.php
AS: Time Series Using the statistical enquiry cycle to investigate time series data involves: • using existing data sets • selecting a variable to investigate • selecting and using appropriate display(s) • identifying features in the data and relating this to the context • finding an appropriate model • using the model to make a forecast • communicating findings in a conclusion.
Excellence! Investigate time series data, with justification and statistical insight involves integrating statistical and contextual knowledge throughout the statistical enquiry cycle, and may include reflecting about the process; considering other relevant variables; evaluating the adequacy of any models; or showing a deeper understanding of models.
Statistical insight involves integratingstatistical and contextual knowledge http://www.nzchildren.co.nz/child_poverty.php
Road to excellence? You need to: understand/relate to the context research it properly and write with insight. They need a structure to work to in order to organise your brains. They need to be familiar with the language of statistics. http://www.point8td.com/perfection-vs-excellence Fake it until you make it
http://www.bbc.co.uk/blogs/theoneshow/consumer/2009/03/25/truancy-should-the-kids-or-the.htmlhttp://www.bbc.co.uk/blogs/theoneshow/consumer/2009/03/25/truancy-should-the-kids-or-the.html Understand and relate to context
Attendance in New Zealand Schools 2012 Something you are familiar with
Attendance in New Zealand Schools 2012 Note the date of the data set
Why are we interested in this investigation? “There has been increasing community, political, and education sector concern over absence from school.” (Mallari, Loader, 2013) Always use referencing http://cityview.worcesterschools.org/modules/cms/pages.phtml?sessionid=&pageid=300890
Background A national survey of state primary and secondary schools in New Zealand in 1977 (Taylor, Sturrock and White 1982) reported that the unjustified absence rate in primary schools was 0.69%, and in secondary schools it was 1.4%. Berwick-Emms (1987). http://studentwork.hss.uts.edu.au/wnm08/scars/source/prischool.html
Broader context – Underlying issue - Referencing The problem of truancy is shared throughout the world (see Reid 1987, Andrews 1986). Whitney (1994:15), a British researcher, notes that ‘Truancy, like poverty, has a lengthy past history, and the two have always been closely related. “Chronic absenteeism is most prevalent among low income students.” Balfanz, 2012
Data Source • http://www.educationcounts.govt.nz/publications/series/2503
Survey Details The Ministry of Education survey on attendance was carried out in the week 11-15 June, 2012 The response rate was 88% Schools recording absences on the paper form were required to make their own judgementas to whether a student was absent for all or part of a day, and whether that absence was justified based on the definitions and instructions supplied.
Are comparisons valid? The survey was carried out in the week of 11-15 June 2012, close to the middle of the second school term. This week was the same week of term as the 2009 and 2011 surveys. By analysing data from a similar time of year, factors such as winter illness would have been at broadly similar levels.
Perspective - numbers In 2012, approximately 62,000 students were absent from school for all or part of a day during the survey week. Of these, 15,000 students were unjustifiably absent from school.
Is this a real decrease or is it pressure on schools by the Ministry to deal with absences?
Main features:Time periods are not at equal intervalsTotal: Between about 10% and 12%Peak: ≈12% in 2009Drop or leveling out since 2009
Similarities/Differences/ReasonsWhat other questions should be asked?
What might be different in the previous graphs if we just looked at secondary?
Always ask questions about it. What would it look like at our school? What might be different?
A snippet Why is this Thursday lower than usual?
Researching and Referencing http://csmaster.sxu.edu/caviles/images/
Why Reference? Referencing is necessary to avoid plagiarism. It allows others to follow up and read what other researchers (writers) have to say about the topic. It will become part of your university life. http://writecite.com/swsi.nsw/
Style I encourage my students to use APA referencing as it is often used in university courses. http://owll.massey.ac.nz/referencing/apa-reference-list.php
Mobile Data Usage September 9, 2013 September 16, 2013
Do not use sites like wikipedia, reddit etc., Go to the referenced sites. “Wikipedia acknowledges that it should not be used as a primary source for research.” The main problem is the lack of authority. http://downwithtyranny.blogspot.co.nz/2011/08/is-wikipedias-real-problem-really-that.html
Briefly • Concise sentences • Passive form (avoid “I”), use impersonal verbs. • Correct tense • Use a writing frame • Vocabulary
PROBLEM and PLAN Understanding and defining the problem. Time series is essentially an investigation into ‘what has already happened and what then is likely to happen’ with consideration of how valid it all is.
Introduction • State the investigation. • Research related to choosing particular variables- not just general research.