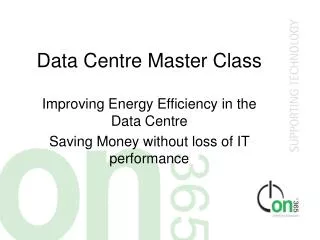
Enhancing Energy Efficiency in Data Centres: Cost Savings without Compromising IT Performance
This masterclass explores strategies for improving energy efficiency in data centres, focusing on operational costs and IT performance. Participants will learn about the electricity supply context, typical operational costs, and energy consumption breakdown. Key topics include efficient design principles, the importance of cold vs. hot aisle containment, and practical quick fixes for reducing energy usage. Attendees will gain insights from UK energy statistics and case studies on potential savings, aiming for significant reductions in energy costs without impacting IT functionality.

Enhancing Energy Efficiency in Data Centres: Cost Savings without Compromising IT Performance
E N D
Presentation Transcript
Data Centre Master Class Improving Energy Efficiency in the Data Centre Saving Money without loss of IT performance
AGENDA • Electricity Supply Background • Cost to Operate a Typical Data Centre • Where does all the energy go? • Some quick fixes • Right Size
AGENDA • Efficient Design • Cold Aisle v Hot Aisle which is the most efficient? • Free cooling – is it free? • Water or DX? • DCiE • Questions
UK Supply 2007 • 400,159 GWh produced • 31,813 GWh to Energy Industry • 26,401 GWh in transmission losses • 117,733 GWh to Industry • 8,254 GWh to transport • 100,908 GWh to Service Industry • 115,050 GWh to Domestic Users Source Digest of UK Energy Statistics
Data Centre Demand • Estimate that DC’s use 3% in total • Equates to 12,000 GWh • Circa. £1 billion in costs • Excludes desktops and distributed items • Excludes standing charge • Excludes other fees
Data Centre Demand • Electricity costs for an average large user is £0.07/kWh + £0.00456/kWh climate change levy • IBM found that the better performing DC’s were spending 43% of energy costs to supply the actual IT load • 57% to power the support equipment
Data Centre Demand • Example for a 200kW IT load • Support load is 265kW • Total bill circa. £303.5K • £130.5K to IT • £173K to support
Data Centre Demand • Same example for a 200kW IT load at worst • Support load is 466kW with split of 30/70 • Total bill circa. £435K • £130.5K to IT • £304.5K to support
Data Centre Demand • Same example for a 200kW IT load at today’s target of 70/30 • Support load is 85kW • Total bill circa. £186.5K • £130.5K to IT • £56K to support
Data Centre Demand • Saving circa £250K in the worst DC’s • £117K in the better DC’s • £1.25M in 5 years • £600K in 5 years
Data Centre Demand • Recent studies showed that most respondents cannot answer the question . . • How energy efficient is your data centre? • 80% had never conducted an energy audit • 77% had never seen their electricity bill
Gas Guzzler or Tree Hugger? • Where does all the waste go? • Useful energy is consumed by the IT equipment • The rest is used to operate equipment that supports or allows us to use and manage the IT equipment
Where does it all go? • Take this 60W light bulb • What does it do in our Data Centre? • It provides light so that we can see and maintain our assets • It costs a kWh every 16 hours or so • It gives off 60W of heat • All in all it costs £60/year to run
Where does it all go? • £60 is not much • 250m² technical space amounts to £7500 per annum at 30W/m² • Most of us leave the lighting on 24/7 • Fit PIR sensors • Zone the lighting • Very low cost against savings • Little risk to DC
Where does it all go? • Power path to IT • UPS • PDU’s • Cabling • ATS
Where does it all go? • Power path to support equipment • Cooling • Lights • Fire • Security • Generator • Switchgear
Some quick fixes • Close holes in the raised floor • Close holes in the racks • De-clutter the raised floor void • Fit baffles • Hot and cold aisles • Fit air distribution • Can gain 6% savings
Some quick fixes • Raise the ACU set-point • Stop the humidification de-humidification cycle • Remove UPS that are fed by UPS • Have the ACU checked and balanced • Don’t just keep adding ACU
Right Size Equipment • UPS operating at low load percentage? • 150kVA UPS running at 32kW (25%) • Efficiency = 76% • Power draw = 40kW • £5256 per annum to run losses • New UPS = 96% efficiency • £840 per annum to run • 1.28kW heat loss versus 8kW
Efficient Design • UPS for A and B supplies • Two UPS each running at 50% load • Efficiency circa. 88% 2 x 24kW losses
5 x 6kW losses = 30kW 18kW saving or £11,826/annum
Efficient Design • Cooling • Biggest Problem is Air Mixing and bypass (short circuit) • Hot and Cold • Heat Energy Direction • You and the radiator • You and the under-floor heating • You and the space suit
Efficient Design • 35ºC air return = 17.3kW • 32ºC air return = 13.8kW • 29ºC air return = 9.7kW • 26ºC air return = 5.6kW • Mixing and air bypass are very expensive
Efficient Design • Variable speed control fans • Place the ACU and load as close together as possible • Contain hot and cold air and keep them separate
Cold Aisle v Hot Aisle • Which is the most efficient?
Cold Aisle Containment 17°C 11°C AIR AIR 30°C 31°C AIR ∞ 24°C 29°C 32°C 32°C 20°C AIR
Hot Aisle Containment 20°C 14°C AIR 24°C 24°C 24°C AIR 32°C AIR 23°C 23°C
CACS v HACS • 18 x InRow RC • Possible air flow 210,888 m³/h • Required air flow = 108,900 m³/h (52%) • Power draw =7.4 kW • 365 x 24 x 7.4 x 0.075 = £4,862 • 8 x CRAC (Uniflair 4300A) • Possible air flow 192,384 m³/h • Required air flow = 136,125 m³/h (71%) • Power draw =11.3 kW • 365 x 24 x 11.3 x 0.075 = £7,425 • Saving HACS vs. CACS = £2,563 per annum
PLUS other benefits • Reduced usage of free cooling when implementing CACS efficiency ↓ • Extra cost for extra height of raised floor (effect might be minimal, though) PLUS some operational reasons • Predictability of raised floor plenum is critical • No standalone equipment can be placed in CACS room • Warm air volume: CACS: 444 m3 HACS: 113m3 • Cold air volume CACS: 180 m3 HACS: 367m3
More free cooling available with HACS • Facts are: • CW return temperature has to be 3°C colder than supply air temperature • CW supply temperature has to be 3°C warmer than outside air temperature to enable 100% free cooling • Cold air supply of down flow units supporting raised floor cooling have to be 4°C colder than the expected server inlet temperature • Cold air supply of HACS units have to be only 1°C colder than expected server inlet temperature • So, we calculate back from server supply temperature to be 24°C For every day of free cooling we save another £290 on the electrical bill! Savings HACS v CACS (50 days of free cooling more) = £14,500 per annum
Case Study HACS v CACS Summary - Cost Saving Annual saving indoor units: £2,563 per annum Annual saving additional free cooling £14,500 per annum Total benefit for HACS over CACS £17,063 per annum Considering a life time of 10 years Savings add up to £170,630 CAPEX benefit for CACS over HACS £50,000 Break even after 2.9 years
Free Cooling – is it free? • It is the ability to use low external ambient temperature to your advantage • For example at 1ºC external ambient on a chiller you can achieve 100% use of the low ambient and have no mechanical cooling (refrigerant) • Fans and pumps still run
Free Cooling – is it free? • For example at 7ºC external ambient on a chiller you can achieve 50% use of the low ambient and have 50% of mechanical cooling (refrigerant) • In the Midlands, the mean ambient is 9ºC per annum so we can calculate a mix of 40/60 for the whole year • Major savings are experienced
Water or DX? • Water is 35 times more efficient than air • DX plant is generally cheaper • Long distances between CRACS and outside space limits DX installation • Lower running costs for water with free cooling options • Similar maintenance costs • DX = SMALL - Water = HIGH
DCiEData Centre infrastructure Efficiency • DCiE = Main IT Energy Consumption x 100% Total IT Facility Energy Consumption • The higher the figure the more efficient the Data Centre • Follows standard engineering efficiency metrics for other electrical plant • PUE (Power Utilisation Effectiveness) is 1/DCiE
DCiEData Centre infrastructure Efficiency • Difficult to measure • Has to be done over time to allow for equipment cycling, variations in IT workload etc • Does not measure how effective the IT equipment is being used • Is recognised by US Environmental Protection Agency, EU COC and Green Grid
DCiEWhere can you start? • No real industry benchmarks or league tables • You can’t manage what you don’t measure • Much harder to implement with existing installations • Hire expertise and equipment for sampling or longer term assessment • Help with improvement and ROI including timescales
Why look at your DCiE • First stage to securing EU Code of Conduct and implementing COC best practices • Reduce long term operational costs • Market ‘Green Initiatives’ for your business • Mandatory for Government Establishments? • Impending legislation and taxes for climate change levy? • Future energy costs?
In Summary • What’s good for your business is good for our environment • Get the best from what you have • The most efficient Data Centre is the one that does not have to be built • Becoming a Tree Hugger makes good economical sense • Green is definitely LEAN