Download
1 / 33
330 likes | 467 Vues
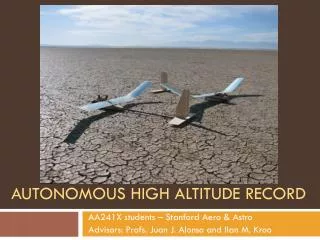
PACER Summer Program High-Altitude Thermodynamics Profile and Clarity Experiment ( HATPaC). Johnte Bass, Herman Neal, Matthew Ware. Mission Goal.

E N D
PACER Summer ProgramHigh-Altitude Thermodynamics Profile and Clarity Experiment (HATPaC) Johnte Bass, Herman Neal, Matthew Ware
Mission Goal • Investigate the temperature, pressure, density and clarity as a function of altitude up to about 100,000 feet in order to study layering in Earth’s lower atmosphere.
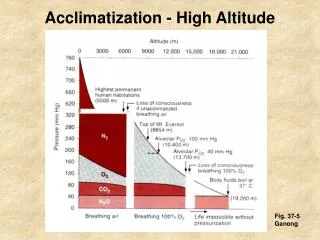
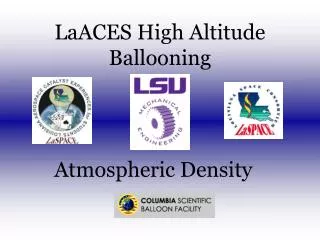
Science Background • The payload will ascend through the troposphere, the tropopause, and into the stratosphere to the upper boundary of the ozone maximum. • This figure represents a typical temperature profile of the layers of the atmosphere. However, the specific profile depends on location, particularly the latitude. There is also a seasonal variation with the tropopause at higher altitudes in summer at latitudes smaller than 60°. • The HATPaC experiment will measure the profile over East Central Texas (35° latitude) in midsummer.
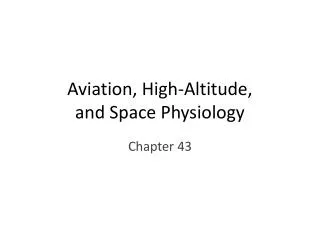
Science Background (continued) • The tropopause is characterized by a region several kilometers thick where the temperature is relatively constant. High altitude sounding measurements indicates that temperature over 2 km altitude range varies 3 °C or less. • This figure shows the pressure and density profiles as determined by the NRLMSISE Standard Atmosphere Model. • The atmosphere may be considered as an ideal gas. The ideal gas law may be used to calculate the density from measurements of pressure and temperature: r = MP/RT.
Science Objectives 1. Identify the zones of the Earth’s lower atmosphere. 2. Determine the altitude of the tropopause. 3. Develop a temperature profile of the atmosphere. 4. Develop a pressure profile of the atmosphere. 5. Develop a density profile of the atmosphere. 6. Qualitatively evaluate atmospheric clarity as altitude varies. 7. Compare accepted models of the atmosphere to measurements. 8. Presentfindings
Science Requirements • Make measurements every 15 seconds. • Calculate density within 5% uncertainty which includes: • Measure temperature to within 1 °C (0.5% at the tropopause). • Measure pressure to which 1 mbar (5% at the tropopause). • Determine the altitude to within 100 meters. • Take photographs during ascent and descent every 15 seconds up to an altitude of 100,000 feet.
Technical Objectives 1. Build and fly a payload and retrieve the data. 2. Measure temperature over the range -80 ˚C ≤ T ≤ 40 ˚C. 3. Measure pressure over the range 5 mbar ≤ P ≤ 1000 mbar. 4. Calculate the atmospheric density using the ideal gas law. 5. Take photographs of the external environment using two onboard cameras for the duration of the flight. The two cameras will provide an overlapping field of view from 10˚ above the horizon to 60˚ below the horizon. 6. Store thermodynamic data in memory contained within the payload control computer and photographic images in flash memory within the cameras. 7. Correlate payload data with mission telemetry data to determine the altitude of each measurement.
Technical Requirements • Payload must remain intact from launch to recovery. • Power system must operate over the temperature range -80 °C ≤ T ≤ 40 °C with the capacity to power the BalloonSat, sensors, and data archive for the duration of the flight. • Temperature sensor able to measure over the range -80 °C ≤ T ≤ 40 °C. • Pressure sensor able to measure over the range 5 mbar ≤ P ≤ 1000 mbar. • Camera able to operate over the temperature range -80 °C ≤ T ≤ 40 °C and pressure range 5 mbar ≤ P ≤ 1000 mbar. • Record time to 15 second accuracy. • Data archive system with the capacity to store measurements by the sensors and real time clock for the duration of the flight (approximately 750 data records) • Photograph storage media with the capacity to store about 1500 1.3 megapixel (1600 1200 pixels) images. • Ground system which can download, analyze, and graphically display payload measurements.
Payload Construction • The Pacer payload is constructed using a material called Foamular. • This type of material can withstand extreme temperatures, pressure and shock from the landing of the payload. • The material that will reinforce the payload is silver mylar which can withstand cold temperatures and also work as a good insulator. • The plywood that the camera are on is stuck together with the cameras using Gorilla Glue.
Mechanical Design • Closed Capsule (Right Side View) • Closed Capsule (Left Side View)
Mechanical Design (continued) • Lid (Top View) • Lid (Side View)
Mechanical Design (continued) • Capsule Interior w/o BalloonSat • Capsule Interior w/BalloonSat
PACER HATPaC Flight Badge • Combination of the US Army 93rd Infantry Division patch and GSU logo. • The 93rd was to fight in World War I, but was sent to France to help the French Army. • The object covering the GSU logo is the French steel helmet. • The 93rd’s Division badge has the same colors as GSU. Herman Neal is an US Army veteran. Dr. Ware’s father served in the Infantry in France during World War I.
Acknowledgements • PACER • LaSPACE, the Louisiana Space Grant Consortium • National Science Foundation • NASA Columbia Scientific Balloon Facility • Louisiana State University-Baton Rouge